
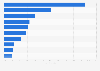


Purchase intent of electric cars in the Netherlands 2017-2019
As of 2019, five percent of the respondents indicated that they have the intention to purchase an electric car, whereas the majority of the respondents mentioned to have either no period of time in mind or no intention to purchase an electric car.

