, competing with other big-name brands such as Domino’s Pizza, Pizza Hut, and Little Caesars. Papa Johns, like many other
, is known for its quick service, low prices, and limited menu options. As well as pizza, the chain offers fried chicken, side dishes, desserts, and its signature garlic sauce. The combined sales from these products resulted in
reaching a new peak in 2023. Papa John’s enduring success is emblematic of the country’s wider pizza industry. In 2023,
reached an all-time high of 41.3 billion U.S. dollars.
How successful is Papa Johns?
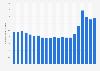
Although Papa Johns reported its highest revenue stream to date in 2023, the company has experienced some difficulties in recent years. Papa Johns faced a significant decline in public opinion due to a series of controversies surrounding its founder, John Schnatter, in 2017 and 2018. As a result of this negative publicity, the
net income of Papa Johns plummeted by nearly 100 million U.S. dollars in 2018, and this declining trend was reflected in other key performance indicators such as the company’s
operating income. However, Papa John’s financials rebounded in the following years and during the onset of the
coronavirus (COVID-19) pandemic, the company even managed to increase its
total assets worldwide.
Is Papa Johns a global brand?
From its beginnings inside of a Kentucky broom closet in 1984, Papa Johns has since expanded to become an international pizza chain. In 2023, the
number of Papa Johns restaurants worldwide was over 5.9 thousand. Of those stores, over three thousand were in the U.S. and the
remaining establishments were situated in locations all across the globe. The United Kingdom had the most Papa John's stores of any European country and China had the most establishments of any Asian country. Despite the company’s substantial international presence,
most of Papa John’s worldwide revenue was generated in North America in 2023. For instance, the company’s domestic company-owned restaurant sales exceeded 726 million U.S. dollars that year.
This text provides general information. Statista assumes no
liability for the information given being complete or correct.
Due to varying update cycles, statistics can display more up-to-date
data than referenced in the text.