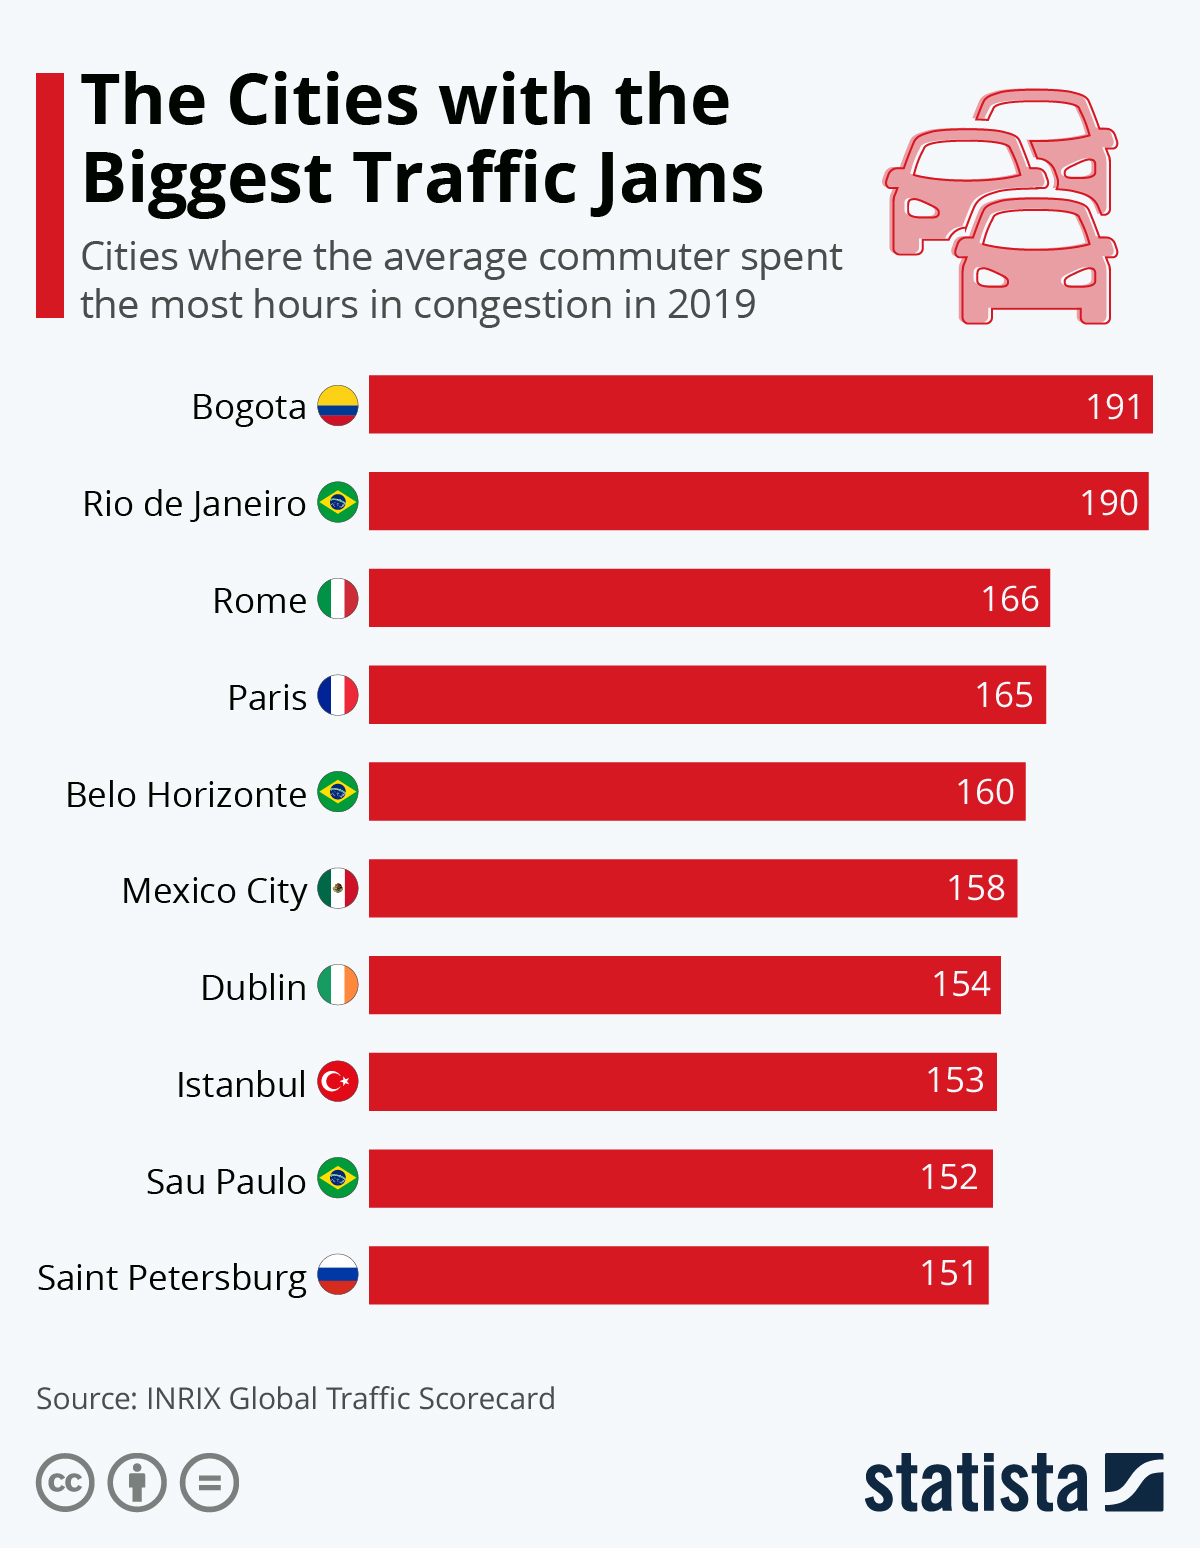
New analysis by INRIX shows that on average last year, each commuter in the Colombian capital Bogota spent a huge 191 hours stuck in traffic - equivalent to almost 8 full days. Second-placed Rio de Janeiro frustrated its drivers for 190 hours, while third-placed Rome came in at an infuriating 166. Congestion isn't merely an annoyance for drivers though. According to the source, poor traffic flow cost the United States economy almost $88 billion last year. The INRIX 2019 Scorecard analyses mobility in over 900 cities across 43 countries.
Infographic Newsletter
Statista offers daily infographics about trending topics, covering:Economy & Finance, Politics & Society, Tech & Media, Health & Environment, Consumer, Sports and many more.
Related Infographics
FAQ
- The Statista "Chart of the Day", made available under the Creative Commons License CC BY-ND 3.0, may be used and displayed without charge by all commercial and non-commercial websites. Use is, however, only permitted with proper attribution to Statista. When publishing one of these graphics, please include a backlink to the respective infographic URL. More Information
- The Statista "Chart of the Day" currently focuses on two sectors: "Media and Technology", updated daily and featuring the latest statistics from the media, internet, telecommunications and consumer electronics industries; and "Economy and Society", which current data from the United States and around the world relating to economic and political issues as well as sports and entertainment.
- For individual content and infographics in your Corporate Design, please visit our agency website www.statista.design
Any more questions?
Get in touch with us quickly and easily.
We are happy to help!
Do you still have questions?
Feel free to contact us anytime using our contact form or visit our FAQ page.
Your contact to the Infographics Newsroom
Statista Content & Design
Need infographics, animated videos, presentations, data research or social media charts?
The Statista Infographic Newsletter
Receive a new up-to-date issue every day for free
-
Our infographics team prepares current information in a clear and understandable format
-
Relevant facts covering media, economy, e-commerce, and FMCG topics
-
Use our newsletter overview to manage the topics that you have subscribed to