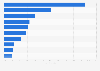
The total consumption of aluminium in trucks in China was forecast to reach 1.4 million tons by 2030. This increase was related to the forecast growth in production of trucks in China.
Total consumption of aluminium for truck production in China from 2009 to 2030 (in million metric tons)
Basic Account
Get to know the platform
You only have access to basic statistics.
This statistic is not included in your account.
Starter Account
The ideal entry-level account for individual users
- Instant access to 1m statistics
- Download in XLS, PDF & PNG format
- Detailed references
$59 USD $39 USD / Month *
in the first 12 months
Professional Account
Full access
Business Solutions including all features.
* Prices do not include sales tax.
Statistics on Passenger car market in Europe
Overview
7
- Premium Statistic Passenger cars - sales by region 2021
- Premium Statistic Revenue of motor vehicle manufacturing in the EU 2011-2020
- Premium Statistic European motor vehicle and trailer revenue by major country 2020
- Premium Statistic Growth forecast for the international auto sales by market 2020-2023
- Premium Statistic YTD market share of selected car manufacturers in Europe 2021
- Premium Statistic Leading passenger car brands in the EU-27 2021
- Premium Statistic Leading passenger car brands in the EU-27 by month 2022
Production
6
- Premium Statistic Volume index of motor vehicle production in the EU by country 2020-2022
- Premium Statistic Segmentation of European motor vehicle production - 2018-2021
- Premium Statistic Passenger car production in selected countries in Europe 2021
- Premium Statistic Car production in Germany from 1990 to 2021
- Premium Statistic Motor vehicle manufacturing employment in the European Union 2014-2018
- Basic Statistic Automotive industry jobs at risk in Europe by country - COVID-19
Sales
7
- Basic Statistic Monthly car sales in Europe through April 2022
- Basic Statistic Trend in new passenger car registrations in Europe 2022
- Premium Statistic Passenger car sales in selected European countries 2021-2022
- Basic Statistic Car registrations in Europe by segment 2021
- Premium Statistic New LCV and car registrations by leading powertrain in the EU-27 2021
- Premium Statistic Passenger car sales in the European Union by fuel type 2022
- Premium Statistic Share of fuel types of new passenger cars in Europe by country 2022
Trade
8
- Premium Statistic EU-27 car exports by destination country 2020-2021
- Premium Statistic EU passenger car export value to the U.S. 2020-2021
- Premium Statistic Passenger car export value from the EU to China 2020-2021
- Premium Statistic Amount of exported vehicles from the EU to South Korea 2015-2020
- Basic Statistic Value of imported vehicles in the EU by exporting country 2020-2021
- Premium Statistic Value of imported passenger cars from the U.S. to the EU 2015-2021
- Premium Statistic Value of imported vehicles from Japan to the EU 2015-2020
- Premium Statistic Value of imported passenger cars from Turkey to the EU 2020-2021
Companies
8
- Basic Statistic Volkswagen AG's sales revenue 2006-2022
- Basic Statistic Volkswagen's revenue by region 2019-2021
- Basic Statistic Volkswagen's EU share of new-car registrations 2021-2022
- Premium Statistic Net revenue of Stellantis 2019-2022
- Premium Statistic Stellantis' net revenue by region 2021
- Premium Statistic Regional sales of Stellantis 2019-2022
- Premium Statistic Renault Group's revenue 2010-2021
- Premium Statistic Renault Group's revenue by region 2018-2021
Further related statistics
19
- Volume for special-duty dumper trucks production in China 2016-2030
- Volume for special purpose trucks production in China 2016-2030
- Volume for light truck production in China 2016-2030
- Volume for tanker trucks production in China 2016-2030
- Volume for mini truck production in China 2016-2030
- Volume for stake trucks production in China 2016-2030
- Volume for common dumper trucks production in China 2016-2030
- Volume for truck production in China 2009-2030
- Volume for van trucks production in China 2016-2030
- Volume for medium truck production in China 2016-2030
- Kuwait's number of trucks in use 2011-2020
- First registrations of trucks in Finland 2010-2020
- Registered multi-axle vehicles India FY 2019, by major city
- First registrations of trucks in Finland 2021, by weight
- First registrations of trucks in Finland 2021, by brand
- Number of registered trucks in Norway 2009-2020
- Number of registered trucks in Norway 2017, by type
- Monthly number of trucks in use in Sweden 2019-2020
- Monthly number of new registrations of trucks in Sweden 2019-2020
Further Content: You might find this interesting as well
Statistics
- Volume for special-duty dumper trucks production in China 2016-2030
- Volume for special purpose trucks production in China 2016-2030
- Volume for light truck production in China 2016-2030
- Volume for tanker trucks production in China 2016-2030
- Volume for mini truck production in China 2016-2030
- Volume for stake trucks production in China 2016-2030
- Volume for common dumper trucks production in China 2016-2030
- Volume for truck production in China 2009-2030
- Volume for van trucks production in China 2016-2030
- Volume for medium truck production in China 2016-2030
- Kuwait's number of trucks in use 2011-2020
- First registrations of trucks in Finland 2010-2020
- Registered multi-axle vehicles India FY 2019, by major city
- First registrations of trucks in Finland 2021, by weight
- First registrations of trucks in Finland 2021, by brand
- Number of registered trucks in Norway 2009-2020
- Number of registered trucks in Norway 2017, by type
- Monthly number of trucks in use in Sweden 2019-2020
- Monthly number of new registrations of trucks in Sweden 2019-2020
IAI. (February 21, 2019). Total consumption of aluminium for truck production in China from 2009 to 2030 (in million metric tons) [Graph]. In Statista. Retrieved March 24, 2023, from https://www.statista.com/statistics/1061988/china-aluminium-consumption-in-trucks/
IAI. "Total consumption of aluminium for truck production in China from 2009 to 2030 (in million metric tons)." Chart. February 21, 2019. Statista. Accessed March 24, 2023. https://www.statista.com/statistics/1061988/china-aluminium-consumption-in-trucks/
IAI. (2019). Total consumption of aluminium for truck production in China from 2009 to 2030 (in million metric tons). Statista. Statista Inc.. Accessed: March 24, 2023. https://www.statista.com/statistics/1061988/china-aluminium-consumption-in-trucks/
IAI. "Total Consumption of Aluminium for Truck Production in China from 2009 to 2030 (in Million Metric Tons)." Statista, Statista Inc., 21 Feb 2019, https://www.statista.com/statistics/1061988/china-aluminium-consumption-in-trucks/
IAI, Total consumption of aluminium for truck production in China from 2009 to 2030 (in million metric tons) Statista, https://www.statista.com/statistics/1061988/china-aluminium-consumption-in-trucks/ (last visited March 24, 2023)
Total consumption of aluminium for truck production in China from 2009 to 2030 (in million metric tons) [Graph], IAI, February 21, 2019. [Online]. Available: https://www.statista.com/statistics/1061988/china-aluminium-consumption-in-trucks/