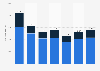
In 2019, 316.6 metric tons of coal were produced per miner in Russia on average per month. The monthly coal production volume per miner increased by nearly 77 metric tons between 2015 and 2018.
Average monthly coal production per miner in Russia from 2012 to 2019 (in metric tons)
Basic Account
Get to know the platform
You only have access to basic statistics.
This statistic is not included in your account.
Starter Account
The ideal entry-level account for individual users
- Instant access to 1m statistics
- Download in XLS, PDF & PNG format
- Detailed references
$69 USD $49 USD / Month *
in the first 12 months
Professional Account
Full access
Business Solutions including all features.
* Prices do not include sales tax.
Statistics on Coal mining in the U.S.
Overview
8
- Premium Statistic Global proven coal reserves by country 2020
- Premium Statistic Proved coal reserves in the U.S. by type 2010-2020
- Premium Statistic Leading soft brown coal producing countries worldwide 2020
- Basic Statistic Coal production in North America 1998-2021
- Premium Statistic Global financing of coal mining companies by bank 2021
- Premium Statistic U.S. coal mining market value 2010-2022
- Basic Statistic Coal consumption in the U.S. by sector 1990-2022
- Premium Statistic Selected figures on the coal industry in the United States 2021 & 2022
Production
7
- Premium Statistic Production of hard coal in the U.S. 1950-2021
- Basic Statistic Lignite production in the U.S. 1970-2021
- Basic Statistic Coal production in the U.S. by on coalbed thickness 2021
- Premium Statistic Leading coal mines in the U.S. by production 2021
- Premium Statistic Leading U.S. states by coal production 2021
- Premium Statistic Leading U.S. states with number of coal mines 2021
- Premium Statistic U.S. production index of the coal mining industry 2017-2022
Mines
3
Exports
3
Companies
7
- Premium Statistic Leading coal producers in the U.S. 2021
- Basic Statistic Coal-mining production share of leading producers in the U.S. 2021
- Premium Statistic Peabody coal sales 2006-2022
- Premium Statistic Peabody Energy's revenue 2005-2022
- Basic Statistic Volume of coal sold by Arch Coal 2010-2022
- Basic Statistic Arch Coal's revenue 2010-2022
- Premium Statistic Number of U.S. businesses in coal mining 2010-2022
Employment
8
- Premium Statistic Coal-mining employment in the U.S. 2011-2021
- Premium Statistic Leading U.S. states by coal-mining jobs 2011-2021
- Premium Statistic Coal-mining employment in the Appalachian region 2011-2021
- Premium Statistic Coal-mining employment in Kentucky 2011-2021
- Basic Statistic Coal-mining employment in Wyoming 2011-2021
- Basic Statistic Coal-mining employment in West Virginia 2011-2021
- Basic Statistic U.S. coal mining employees selected data 2021
- Premium Statistic U.S. coal mining deaths 1900-2021
Further related statistics
9
- U.S. coal production capacity by mine type 2009-2018
- Production of hard coal in China 1993-2018
- Coal production worldwide by region 2015
- U.S. production of coal by leading state 2020
- Forecast coal production in CIS 2019-2050, by scenario
- Coal production in Central & South America 2009-2021
- Poland: Number of enterprises in the mining of coal and lignite industry 2011-2020
- Romania: Number of enterprises in the mining of coal and lignite industry 2011-2020
- Slovenia: Number of enterprises in the mining of coal and lignite industry 2011-2020
Further Content: You might find this interesting as well
Statistics
- U.S. coal production capacity by mine type 2009-2018
- Production of hard coal in China 1993-2018
- Coal production worldwide by region 2015
- U.S. production of coal by leading state 2020
- Forecast coal production in CIS 2019-2050, by scenario
- Coal production in Central & South America 2009-2021
- Poland: Number of enterprises in the mining of coal and lignite industry 2011-2020
- Romania: Number of enterprises in the mining of coal and lignite industry 2011-2020
- Slovenia: Number of enterprises in the mining of coal and lignite industry 2011-2020
PwC. (August 11, 2020). Average monthly coal production per miner in Russia from 2012 to 2019 (in metric tons) [Graph]. In Statista. Retrieved May 29, 2023, from https://www.statista.com/statistics/1124002/monthly-coal-production-per-miner-russia/
PwC. "Average monthly coal production per miner in Russia from 2012 to 2019 (in metric tons)." Chart. August 11, 2020. Statista. Accessed May 29, 2023. https://www.statista.com/statistics/1124002/monthly-coal-production-per-miner-russia/
PwC. (2020). Average monthly coal production per miner in Russia from 2012 to 2019 (in metric tons). Statista. Statista Inc.. Accessed: May 29, 2023. https://www.statista.com/statistics/1124002/monthly-coal-production-per-miner-russia/
PwC. "Average Monthly Coal Production per Miner in Russia from 2012 to 2019 (in Metric Tons)." Statista, Statista Inc., 11 Aug 2020, https://www.statista.com/statistics/1124002/monthly-coal-production-per-miner-russia/
PwC, Average monthly coal production per miner in Russia from 2012 to 2019 (in metric tons) Statista, https://www.statista.com/statistics/1124002/monthly-coal-production-per-miner-russia/ (last visited May 29, 2023)
Average monthly coal production per miner in Russia from 2012 to 2019 (in metric tons) [Graph], PwC, August 11, 2020. [Online]. Available: https://www.statista.com/statistics/1124002/monthly-coal-production-per-miner-russia/