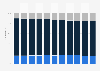
Frequency of performing different in-store activities by Generation Z in Poland 2018
In 2018, the most performed in-store activity by Generation Z Poles was asking for the opinion of family members who were present during the visit to the shop. A total share of 11 percent of young Poles declared they did that very often when shopping with their family.