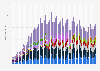
Apple consistently held the highest share of the U.S. smartphone market by shipments, accounting for 15 million smartphones shipped in the United States during the second quarter of 2020. Nearest rival Samsung claimed 7.4 million shipments in the same quarter.
Number of smartphone shipments in the United States by vendor in 2nd quarter 2019 and 2nd quarter 2020
(in millions)
Profit from the additional features of your individual account
Currently, you are using a shared account. To use individual functions (e.g., mark statistics as favourites, set
statistic alerts) please log in with your personal account.
If you are an admin, please authenticate by logging in again.
Learn more about how Statista can support your business.
Canalys. (August 11, 2020). Number of smartphone shipments in the United States by vendor in 2nd quarter 2019 and 2nd quarter 2020 (in millions) [Graph]. In Statista. Retrieved September 21, 2024, from https://www.statista.com/statistics/1154439/us-market-volume-held-by-leading-smartphone-vendors/
Canalys. "Number of smartphone shipments in the United States by vendor in 2nd quarter 2019 and 2nd quarter 2020 (in millions)." Chart. August 11, 2020. Statista. Accessed September 21, 2024. https://www.statista.com/statistics/1154439/us-market-volume-held-by-leading-smartphone-vendors/
Canalys. (2020). Number of smartphone shipments in the United States by vendor in 2nd quarter 2019 and 2nd quarter 2020 (in millions). Statista. Statista Inc.. Accessed: September 21, 2024. https://www.statista.com/statistics/1154439/us-market-volume-held-by-leading-smartphone-vendors/
Canalys. "Number of Smartphone Shipments in The United States by Vendor in 2nd Quarter 2019 and 2nd Quarter 2020 (in Millions)." Statista, Statista Inc., 11 Aug 2020, https://www.statista.com/statistics/1154439/us-market-volume-held-by-leading-smartphone-vendors/
Canalys, Number of smartphone shipments in the United States by vendor in 2nd quarter 2019 and 2nd quarter 2020 (in millions) Statista, https://www.statista.com/statistics/1154439/us-market-volume-held-by-leading-smartphone-vendors/ (last visited September 21, 2024)
Number of smartphone shipments in the United States by vendor in 2nd quarter 2019 and 2nd quarter 2020 (in millions) [Graph], Canalys, August 11, 2020. [Online]. Available: https://www.statista.com/statistics/1154439/us-market-volume-held-by-leading-smartphone-vendors/