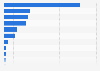
In fiscal year 2023, the total income of Tata Coffee Ltd. amounted to about 10.9 billion Indian rupees. This was an increase as compared to previous year when the total income was 8.87 billion India rupees.
Total income of Tata Coffee Limited from financial year 2016 to 2023 (in billion Indian rupees)
Basic Account
Get to know the platform
You only have access to basic statistics.
This statistic is not included in your account.
Starter Account
The ideal entry-level account for individual users
- Instant access to 1m statistics
- Download in XLS, PDF & PNG format
- Detailed references
$199 USD / Month *
Professional Account
Full access
Business Solutions including all features.
* Prices do not include sales tax.
Other statistics that may interest you Statistics on
About the industry
10
- Premium Statistic Revenue of the coffee market worldwide by country 2022
- Premium Statistic Per-capita volume sales in the coffee market worldwide by country in 2023
- Basic Statistic Change in coffee consumption at home during COVID-19 March 2020, by type
- Premium Statistic Most popular coffee machine brands among U.S. consumers 2017, by gender
- Premium Statistic Coffee maker ownership among U.S. consumers 2017, by gender
- Premium Statistic Most popular coffee machine brands among U.S. consumers 2017, by age
- Premium Statistic Coffee maker ownership among U.S. consumers 2017, by age
- Premium Statistic Purchase reasons for coffee makers among U.S. consumers 2017, by household income
- Premium Statistic Coffee maker ownership among U.S. consumers 2017, by household income
- Premium Statistic Purchase reasons for coffee makers among U.S. consumers 2017, by education
About the region
10
- Premium Statistic Impact of COVID-19 on average monthly value sales of hair colors in India 2020
- Premium Statistic Impact of COVID-19 on average monthly value sales of skin care in India 2019-2020
- Basic Statistic Operating profit of Godrej Consumer Products FY 2015-2023
- Basic Statistic EBITDA of Godrej Consumer Products FY 2015-2023
- Premium Statistic Hindustan Unilever's earnings per share FY 2013-2023
- Premium Statistic Hindustan Unilever's dividend per share FY 2013-2023
- Premium Statistic Hindustan Unilever's reserves and surplus value FY 2013-2023
- Premium Statistic Hindustan Unilever's gross sales value FY 2013-2023
- Premium Statistic Hindustan Unilever's market capitalization FY 2013-2023
- Premium Statistic Hindustan Unilever's share price in BSE FY 2013-2023
Other regions
10
- Premium Statistic U.S. household penetration rate of coffee makers 2009/2015, by type
- Premium Statistic Production volume of fruit and vegetable juices in Belgium 2017, by type
- Premium Statistic Revenue of the non-alcoholic drinks market in Latin America 2018
- Premium Statistic Production volume of apple juice in the EU 2008-2017
- Premium Statistic Production volume of fruit and vegetable juices in Greece 2017, by type
- Premium Statistic Production volume of fruit and vegetable juices in Spain 2017, by type
- Premium Statistic Production volume of fruit and vegetable juices in Lithuania 2017, by type
- Premium Statistic Production volume of fruit and vegetable juices in Romania 2017, by type
- Premium Statistic Production volume of fruit and vegetable juices in Hungary 2017, by type
- Premium Statistic Production volume of fruit and vegetable juices in Slovakia 2017, by type
Related statistics
10
- Premium Statistic Hindustan Unilever's return on capital employed FY 2013-2023
- Premium Statistic Hindustan Unilever's investment value FY 2013-2023
- Premium Statistic Hindustan Unilever's return on net worth FY 2013-2023
- Premium Statistic Revenue share of Tata Consumer Products FY 2023, by region
- Premium Statistic Britannia's annual growth rate of net sales value FY 2016-2023
- Premium Statistic Britannia's quarterly growth rate of net sales value FY 2017-2023
- Premium Statistic Revenue of the Indian FMCG market 2007-2027
- Premium Statistic Nestle India's employees cost 2014-2023
- Premium Statistic Nestle India's net profit 2014-2023
- Premium Statistic Nestle India's total assets 2018-2023
Further related statistics
9
- Under Armour's operating income worldwide 2008-2023
- Mondelez International's net revenue distribution worldwide by sector 2022
- Mondelez International's operating income worldwide 2011-2022
- Mondelez International's global workforce by region 2012-2022
- Victoria's Secret's net sales worldwide from 2010 to 2022
- Net sales of ConAgra Brands worldwide 2012-2023
- Net sales of ConAgra Brands worldwide 2015-2023, by segment
- Kraft Foods Group's net revenue distribution in North America by sector 2011-2014
- Net income of Church & Dwight worldwide 2009-2023
Further Content: You might find this interesting as well
Statistics
- Under Armour's operating income worldwide 2008-2023
- Mondelez International's net revenue distribution worldwide by sector 2022
- Mondelez International's operating income worldwide 2011-2022
- Mondelez International's global workforce by region 2012-2022
- Victoria's Secret's net sales worldwide from 2010 to 2022
- Net sales of ConAgra Brands worldwide 2012-2023
- Net sales of ConAgra Brands worldwide 2015-2023, by segment
- Kraft Foods Group's net revenue distribution in North America by sector 2011-2014
- Net income of Church & Dwight worldwide 2009-2023
BSE (India). (May 8, 2023). Total income of Tata Coffee Limited from financial year 2016 to 2023 (in billion Indian rupees) [Graph]. In Statista. Retrieved April 26, 2024, from https://www.statista.com/statistics/1192375/india-total-income-of-tata-coffee-ltd/
BSE (India). "Total income of Tata Coffee Limited from financial year 2016 to 2023 (in billion Indian rupees)." Chart. May 8, 2023. Statista. Accessed April 26, 2024. https://www.statista.com/statistics/1192375/india-total-income-of-tata-coffee-ltd/
BSE (India). (2023). Total income of Tata Coffee Limited from financial year 2016 to 2023 (in billion Indian rupees). Statista. Statista Inc.. Accessed: April 26, 2024. https://www.statista.com/statistics/1192375/india-total-income-of-tata-coffee-ltd/
BSE (India). "Total Income of Tata Coffee Limited from Financial Year 2016 to 2023 (in Billion Indian Rupees)." Statista, Statista Inc., 8 May 2023, https://www.statista.com/statistics/1192375/india-total-income-of-tata-coffee-ltd/
BSE (India), Total income of Tata Coffee Limited from financial year 2016 to 2023 (in billion Indian rupees) Statista, https://www.statista.com/statistics/1192375/india-total-income-of-tata-coffee-ltd/ (last visited April 26, 2024)
Total income of Tata Coffee Limited from financial year 2016 to 2023 (in billion Indian rupees) [Graph], BSE (India), May 8, 2023. [Online]. Available: https://www.statista.com/statistics/1192375/india-total-income-of-tata-coffee-ltd/