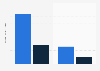
As of 2020, the Mexican state of Veracruz de Ignacio de la Llave accommodated a population of approximately 8.06 million inhabitants. The gender distribution among the residents was relatively equal, with women comprising 52% and men making up 48% of the total population.
Population in Veracruz in 2020, by age group and gender (in 1.000s)
Basic Account
Get to know the platform
You only have access to basic statistics.
This statistic is not included in your account.
Starter Account
The ideal entry-level account for individual users
- Instant access to 1m statistics
- Download in XLS, PDF & PNG format
- Detailed references
$199 USD / Month *
Professional Account
Full access
Business Solutions including all features.
* Prices do not include sales tax.
Other statistics that may interest you Demographics of Mexico
Population overview
8
- Basic Statistic Total population of Mexico 2029
- Basic Statistic Population growth in Mexico 2022
- Basic Statistic Mexico: total population 2022, by age & gender
- Basic Statistic Mexico: total population 2022, by state
- Basic Statistic Population density in Mexico 2011-2021
- Basic Statistic Population density in Mexico 2020, by region
- Basic Statistic Urbanization in Mexico 2022
- Basic Statistic Age dependency ratio Mexico 1980-2022
Births & fertility
5
Death & life expectancy
6
- Premium Statistic Death rate in Mexico 2012-2022
- Premium Statistic Mexico: death toll 2015-2050
- Premium Statistic Leading causes of death in Mexico 2021, by category
- Basic Statistic Infant mortality rate in Mexico 2022
- Premium Statistic Mexico: life expectancy at birth 2015-2050
- Premium Statistic Life expectancy at birth in Mexico 2007-2022, by gender
Marriage & divorce
6
- Premium Statistic Distribution of the population by marital status in Mexico 2020, by gender
- Premium Statistic Number of marriages in Mexico 2001-2021
- Premium Statistic Number of homosexual marriages in Mexico 2010-2022
- Premium Statistic Average age at marriage in Mexico 2011-2021, by gender
- Premium Statistic Mexico: number of divorces 2001-2021
- Premium Statistic Number of divorces per 100 marriages in Mexico 2001-2021
Migration
4
Indigenous and afro-descendant population
4
- Basic Statistic Indigenous and Afro-descendant population and households in Mexico 2020
- Premium Statistic States with the highest share of Afro-Mexicans 2020
- Premium Statistic Speakers of indigenous languages in Mexico 2020, by language
- Premium Statistic Speakers of indigenous languages Mexico 2020, by region
Further Content: You might find this interesting as well
DataMéxico. (November 5, 2022). Population in Veracruz in 2020, by age group and gender (in 1.000s) [Graph]. In Statista. Retrieved June 13, 2024, from https://www.statista.com/statistics/1412022/population-by-group-age-gender-veracruz-mexico/
DataMéxico. "Population in Veracruz in 2020, by age group and gender (in 1.000s)." Chart. November 5, 2022. Statista. Accessed June 13, 2024. https://www.statista.com/statistics/1412022/population-by-group-age-gender-veracruz-mexico/
DataMéxico. (2022). Population in Veracruz in 2020, by age group and gender (in 1.000s). Statista. Statista Inc.. Accessed: June 13, 2024. https://www.statista.com/statistics/1412022/population-by-group-age-gender-veracruz-mexico/
DataMéxico. "Population in Veracruz in 2020, by Age Group and Gender (in 1.000s)." Statista, Statista Inc., 5 Nov 2022, https://www.statista.com/statistics/1412022/population-by-group-age-gender-veracruz-mexico/
DataMéxico, Population in Veracruz in 2020, by age group and gender (in 1.000s) Statista, https://www.statista.com/statistics/1412022/population-by-group-age-gender-veracruz-mexico/ (last visited June 13, 2024)
Population in Veracruz in 2020, by age group and gender (in 1.000s) [Graph], DataMéxico, November 5, 2022. [Online]. Available: https://www.statista.com/statistics/1412022/population-by-group-age-gender-veracruz-mexico/