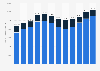
Number of automobiles in China 2011-2022
As of 2022, the number of automobiles in China amounted to 319 million. Over the past decade, car parc in China has been increasing significantly by more than 132 percent.
Status quo of car parc in China
Car parc refers to the number of registered motor vehicles in use in a region. Yet the term differs from vehicle parc by excluding motorcycles and agricultural vehicles. The car parc of China has been increasing exponentially due to the rapidly increasing new vehicle registrations. Guangdong province has the highest number of registered vehicles in the country. In 2022, the southern province had around 2.65 million newly registered motor vehicles. In the same year, more than 20 million small passenger vehicles were registered for the first time nationwide while new registrations of other passenger motor vehicles ranged between 167 and 66,735.
Measures to discourage car use
In recent years, negative effects of the constantly increasing car parc, such as heavy traffic jams and deteriorating air quality, started to surface in China. Several urban centers in China have thus introduced regulations to discourage car use, which prevent cars from being driven on certain days depending on the last digit of the plate number. As these policies failed to mitigate the effects of increasing car use, other measures, especially the plate number lottery schemes in cities such as Beijing, Tianjin, and Shanghai were introduced. Would-be drivers need to participate in a complicated lottery process to win a license plate before purchasing a vehicle, while a license plate could cost more than a car in the secondary market.