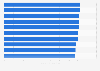
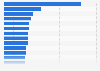
This statistic shows the change in the crime rate in the United States from 2018 to 2019, by state. The crime rate in Vermont increased by 8.43 percent from 2018 to 2019. Moreover, the overall crime rate in the United States decreased by four percent during the same time period.
Percent change in crime rate in the U.S. from 2018 to 2019, by state
Basic Account
Get to know the platform
You only have access to basic statistics.
This statistic is not included in your account.
Starter Account
The ideal entry-level account for individual users
- Instant access to 1m statistics
- Download in XLS, PDF & PNG format
- Detailed references
$59 USD $39 USD / Month *
in the first 12 months
Professional Account
Full access
Business Solutions including all features.
* Prices do not include sales tax.
Statistics on Crime worldwide
Overview
7
- Premium Statistic World's most dangerous countries 2022, by homicide rate
- Basic Statistic World's most dangerous cities, by murder rate 2022
- Premium Statistic Business costs of organized crime - countries with the lowest costs 2019
- Premium Statistic Business costs of organized crime - countries with the highest costs 2019
- Basic Statistic Most peaceful countries in the world 2022
- Basic Statistic Number of death sentences worldwide 2021, by country
- Basic Statistic Number of executions worldwide 2021, by country
Violent Crime
7
- Premium Statistic Leading countries at risk for genocide by percent risk 2021/22
- Basic Statistic Reported violent crime rate in the U.S. 1990-2021
- Basic Statistic Latin America & Caribbean: intentional homicide rate 2020, by country
- Basic Statistic Latin America: femicide rate 2021, by country
- Basic Statistic Homicide rate in Europe 2020, by country
- Premium Statistic Number of violent civilian attacks recorded in Africa 2000-2023
- Basic Statistic Fatalities due to one sided-violence in Africa 2021
Terrorism
7
- Basic Statistic Global terrorism index 2022
- Basic Statistic Terrorist attacks by region 2007-2021
- Basic Statistic Terrorist attacks in 2020, by country
- Basic Statistic Terrorism - number of fatalities worldwide 2006-2020
- Basic Statistic Countries with the highest number of deaths by terrorism 2021
- Premium Statistic Attack types used terrorist attacks worldwide 2020
- Basic Statistic Most active terrorist organizations worldwide 2020, by number of attacks
Cybercrime
7
- Premium Statistic Global number of cyber attacks in financial sector 2013-2021
- Basic Statistic Leading cyber crime victim loss categories worldwide 2022
- Basic Statistic Cybercrime encounter rate in selected countries 2022
- Basic Statistic Most reported types of cyber crime worldwide 2022, by number of individuals affected
- Basic Statistic Cyber crime incidents worldwide 2020-2021, by industry and organization size
- Basic Statistic Malware: most-targeted industries 2020-2021
- Premium Statistic Phishing: distribution of attacks 2022, by country
Human trafficking
5
- Premium Statistic Number of human trafficking victims identified in 2021, by region
- Premium Statistic Human trafficking prosecutions in 2021, by region
- Premium Statistic Human trafficking convictions in 2021, by region
- Premium Statistic Share of sex trafficking victims globally 2003-2022, by gender and region
- Premium Statistic Leading means of control experienced by sex trafficking victims 2003-2021
Arrests and imprisonment
7
- Basic Statistic Incarceration rates in selected countries 2023
- Basic Statistic Number of suspects arrested for terrorism in the EU 2010-2021
- Basic Statistic Incarceration rate in European countries in 2021
- Basic Statistic Countries with the largest prison occupancy rate in LAC 2022
- Premium Statistic Prison population rates in Latin America & the Caribbean 2022, by country
- Premium Statistic Prisoners per 100,000 inhabitants APAC 2022, by country
- Premium Statistic State prisoner imprisonment rate in the U.S. 2021, by state
Further related statistics
16
- Crimes committed in the U.S. 2020, by state
- Crime rate U.S. 2020, by state
- U.S.: rate of violent victimization from 2008 to 2012, by poverty level
- Nonmetropolitan counties - crime rate U.S. 2020, by type
- Public worry about crimes in Scotland in 2017/18
- Cities outside metropolitan areas - crime rate U.S. 2020, by type
- Public schools in the U.S. - crime rate in 2010
- Number of crimes recorded in St. Petersburg 2010-2021
- Scotland: how men and women view the presence of crime in their area 2017/18
- Commercial crime rates in Singapore 2012-2021
- Scotland: how locals view the presence of crime in their area, by age 2017/18
- Violent crimes committed in the U.S. 2021, by state
- Change in violent crime rate in the U.S. 2020, by state
- Violent crime severity index in Canada 2021, by province
- Canada: violent crime rate 2000-2021
- Rate of assaults in Europe 2019, by country
Further Content: You might find this interesting as well
Statistics
- Crimes committed in the U.S. 2020, by state
- Crime rate U.S. 2020, by state
- U.S.: rate of violent victimization from 2008 to 2012, by poverty level
- Nonmetropolitan counties - crime rate U.S. 2020, by type
- Public worry about crimes in Scotland in 2017/18
- Cities outside metropolitan areas - crime rate U.S. 2020, by type
- Public schools in the U.S. - crime rate in 2010
- Number of crimes recorded in St. Petersburg 2010-2021
- Scotland: how men and women view the presence of crime in their area 2017/18
- Commercial crime rates in Singapore 2012-2021
- Scotland: how locals view the presence of crime in their area, by age 2017/18
- Violent crimes committed in the U.S. 2021, by state
- Change in violent crime rate in the U.S. 2020, by state
- Violent crime severity index in Canada 2021, by province
- Canada: violent crime rate 2000-2021
- Rate of assaults in Europe 2019, by country
FBI. (September 28, 2020). Percent change in crime rate in the U.S. from 2018 to 2019, by state [Graph]. In Statista. Retrieved March 31, 2023, from https://www.statista.com/statistics/301560/us-crimes-committed-state/
FBI. "Percent change in crime rate in the U.S. from 2018 to 2019, by state." Chart. September 28, 2020. Statista. Accessed March 31, 2023. https://www.statista.com/statistics/301560/us-crimes-committed-state/
FBI. (2020). Percent change in crime rate in the U.S. from 2018 to 2019, by state. Statista. Statista Inc.. Accessed: March 31, 2023. https://www.statista.com/statistics/301560/us-crimes-committed-state/
FBI. "Percent Change in Crime Rate in The U.S. from 2018 to 2019, by State." Statista, Statista Inc., 28 Sep 2020, https://www.statista.com/statistics/301560/us-crimes-committed-state/
FBI, Percent change in crime rate in the U.S. from 2018 to 2019, by state Statista, https://www.statista.com/statistics/301560/us-crimes-committed-state/ (last visited March 31, 2023)
Percent change in crime rate in the U.S. from 2018 to 2019, by state [Graph], FBI, September 28, 2020. [Online]. Available: https://www.statista.com/statistics/301560/us-crimes-committed-state/