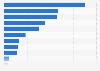
This statistic represents the distribution of silver powder production by major countries from 2011 to 2016, with a forecast for 2017. In 2011, the U.S. produced around 68 percent of the silver powder produced worldwide, and by 2016, the production share was lowered to 40 percent.
Distribution of annual silver powder production by country from 2011 to 2017
Profit from the additional features of your individual account
Currently, you are using a shared account. To use individual functions (e.g., mark statistics as favourites, set
statistic alerts) please log in with your personal account.
If you are an admin, please authenticate by logging in again.
Learn more about how Statista can support your business.
The Silver Institute. (November 15, 2017). Distribution of annual silver powder production by country from 2011 to 2017 [Graph]. In Statista. Retrieved September 20, 2024, from https://www.statista.com/statistics/495555/share-of-global-silver-powder-production-by-country/
The Silver Institute. "Distribution of annual silver powder production by country from 2011 to 2017." Chart. November 15, 2017. Statista. Accessed September 20, 2024. https://www.statista.com/statistics/495555/share-of-global-silver-powder-production-by-country/
The Silver Institute. (2017). Distribution of annual silver powder production by country from 2011 to 2017. Statista. Statista Inc.. Accessed: September 20, 2024. https://www.statista.com/statistics/495555/share-of-global-silver-powder-production-by-country/
The Silver Institute. "Distribution of Annual Silver Powder Production by Country from 2011 to 2017." Statista, Statista Inc., 15 Nov 2017, https://www.statista.com/statistics/495555/share-of-global-silver-powder-production-by-country/
The Silver Institute, Distribution of annual silver powder production by country from 2011 to 2017 Statista, https://www.statista.com/statistics/495555/share-of-global-silver-powder-production-by-country/ (last visited September 20, 2024)
Distribution of annual silver powder production by country from 2011 to 2017 [Graph], The Silver Institute, November 15, 2017. [Online]. Available: https://www.statista.com/statistics/495555/share-of-global-silver-powder-production-by-country/