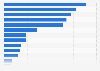


Share of consumers who own a fish in Canada 2015, by gender
This statistic shows the share of adults who own a fish in Canada as of summer 2015, by gender. During the survey, nine percent of the female respondents said they owned at least one fish, compared to 10 percent of male respondents.


