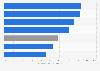
Administrative area of Busan, South Korea 2022, by district
In 2022, among the districts of Busan Metropolitan City in South Korea, Gijang-gun had the greatest administrative area, at approximately 218.33 square kilometers. It is located in the city's northeast.