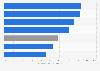
In 2022, among the districts of Gwangju Metropolitan City in South Korea, Gwangsan-gu had the greatest administrative area, at approximately 222.7 square kilometers. The city of Gwangju is located in the country's southwest.
Administrative area of Gwangju, South Korea as of 2022, by district
(in square kilometers)
Profit from the additional features of your individual account
Currently, you are using a shared account. To use individual functions (e.g., mark statistics as favourites, set
statistic alerts) please log in with your personal account.
If you are an admin, please authenticate by logging in again.
Learn more about how Statista can support your business.
KOSIS. (August 9, 2023). Administrative area of Gwangju, South Korea as of 2022, by district (in square kilometers) [Graph]. In Statista. Retrieved November 09, 2024, from https://www.statista.com/statistics/755168/south-korea-administrative-area-of-gwangju-by-district/
KOSIS. "Administrative area of Gwangju, South Korea as of 2022, by district (in square kilometers)." Chart. August 9, 2023. Statista. Accessed November 09, 2024. https://www.statista.com/statistics/755168/south-korea-administrative-area-of-gwangju-by-district/
KOSIS. (2023). Administrative area of Gwangju, South Korea as of 2022, by district (in square kilometers). Statista. Statista Inc.. Accessed: November 09, 2024. https://www.statista.com/statistics/755168/south-korea-administrative-area-of-gwangju-by-district/
KOSIS. "Administrative Area of Gwangju, South Korea as of 2022, by District (in Square Kilometers)." Statista, Statista Inc., 9 Aug 2023, https://www.statista.com/statistics/755168/south-korea-administrative-area-of-gwangju-by-district/
KOSIS, Administrative area of Gwangju, South Korea as of 2022, by district (in square kilometers) Statista, https://www.statista.com/statistics/755168/south-korea-administrative-area-of-gwangju-by-district/ (last visited November 09, 2024)
Administrative area of Gwangju, South Korea as of 2022, by district (in square kilometers) [Graph], KOSIS, August 9, 2023. [Online]. Available: https://www.statista.com/statistics/755168/south-korea-administrative-area-of-gwangju-by-district/