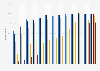
This statistic shows the age brackets of Apple Pay and Android Pay users in the United Kingdom (UK) in 2016. A relation was detected between age and use of mobile payment systems - with those aged between 16 and 34 amounting to almost sixty percent of Apple Pay and Android Pay users in the United Kingdom (UK) during 2016. Those aged over 65 years only made up three percent of Apple and Android users.
Apple Pay and Android Pay user penetration rates in the United Kingdom (UK) 2016, by age
Basic Account
Get to know the platform
You only have access to basic statistics.
This statistic is not included in your account.
Single Account
The ideal entry-level account for individual users
- Instant access to 1m statistics
- Download in XLS, PDF & PNG format
- Detailed references
$59 $39 / Month *
in the first 12 months
Corporate Account
Full access
Corporate solution including all features.
* Prices do not include sales tax.
Further Content: You might find this interesting as well
Statistics
- Share of payments made with cash in the United Kingdom (UK) 2006-2016
- Number of consumer payments in the United Kingdom (UK) 2016, by category
- Town centre: average spend in Great Britain 2012-2013, by reason for visit
- UK consumers spending more on clothing and footwear 2011-2015
- Consumers spending more if they have an associated loyalty card in Canada 2015
- How much do you spend on a facial cream product?
- Ramadan spending habits change via VAT introduction in Saudi Arabia 2018
- Average spending on back-to-school items in the United Kingdom (UK) 2016-2018
- Black Friday: shoppers who spent more in the United Kingdom (UK) 2014, by age
- UK consumers spending more on utilities 2012-2016
- UK consumers expecting to spend more on alcohol and tobacco 2011-2015
- Average spend on Valentine's Day in the United Kingdom (UK) 2017, by gender
- UK consumers expecting to spend more on clothing and footwear 2011-2015
- UK consumers spending more on phone, internet and cable subscriptions 2011-2015
- UK retirement: over-55s change in spending on personal goods and services 2011-2013
- Eating out spending behavior in Great Britain in December 2016, by with/without kids
- Eating out/drinking out spending behavior in Great Britain in December 2016, by age
- Average annual spend on sports in the U.S. per person as of August 2017, by type
- Chile: stability & regularity of household income 2016
Payments UK. (October 1, 2017). Apple Pay and Android Pay user penetration rates in the United Kingdom (UK) 2016, by age [Graph]. In Statista. Retrieved January 19, 2021, from https://www.statista.com/statistics/795674/apple-and-android-pay-use-by-age-uk/
Payments UK. "Apple Pay and Android Pay user penetration rates in the United Kingdom (UK) 2016, by age." Chart. October 1, 2017. Statista. Accessed January 19, 2021. https://www.statista.com/statistics/795674/apple-and-android-pay-use-by-age-uk/
Payments UK. (2017). Apple Pay and Android Pay user penetration rates in the United Kingdom (UK) 2016, by age. Statista. Statista Inc.. Accessed: January 19, 2021. https://www.statista.com/statistics/795674/apple-and-android-pay-use-by-age-uk/
Payments UK. "Apple Pay and Android Pay User Penetration Rates in The United Kingdom (Uk) 2016, by Age." Statista, Statista Inc., 1 Oct 2017, https://www.statista.com/statistics/795674/apple-and-android-pay-use-by-age-uk/
Payments UK, Apple Pay and Android Pay user penetration rates in the United Kingdom (UK) 2016, by age Statista, https://www.statista.com/statistics/795674/apple-and-android-pay-use-by-age-uk/ (last visited January 19, 2021)