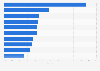
This statistic displays the media value of car brands in the Netherlands in the fourth quarter of 2017 (in 1,000 euros). It shows that in this quarter, Volkswagen was the car brand with the highest media value. In total, car brands sold a media value of over 300 million euros using paid, owned and earned media.
Media value of car brands in the Netherlands in the fourth quarter of 2017 (in 1,000 euros)
Basic Account
Get to know the platform
You only have access to basic statistics.
This statistic is not included in your account.
Starter Account
The ideal entry-level account for individual users
- Instant access to 1m statistics
- Download in XLS, PDF & PNG format
- Detailed references
$69 USD $49 USD / Month *
in the first 12 months
Professional Account
Full access
Business Solutions including all features.
* Prices do not include sales tax.
Statistics on Ford Motor Company in the United States
Overview
6
- Premium Statistic Most valuable automotive brands worldwide by brand value 2022
- Premium Statistic Automotive manufacturers' estimated market share in the U.S. 2022
- Premium Statistic U.S.: best-selling car brands 2022
- Premium Statistic U.S. quarterly hybrid and plug-in hybrid electric vehicle sales by brand 2020-2022
- Premium Statistic U.S. quarterly battery electric vehicle sales by model 2020-2022
- Premium Statistic U.S. consumer satisfaction: Ford 2006-2022
Financials
6
- Premium Statistic Ford's total revenue 2008-2022
- Premium Statistic Ford's revenue by region 2021 and 2022
- Premium Statistic Net income or loss of the Ford Motor Company 2007-2022
- Basic Statistic Ford's R&D costs 2013-2022
- Premium Statistic Ford Motor's advertising spending in the U.S. 2007-2021
- Basic Statistic Debt of the Ford Motor Company 2007-2022
Segments
6
- Premium Statistic Ford's revenue by segment 2021
- Premium Statistic Ford's car sales by country 2022
- Premium Statistic Europe: Ford car sales from 2011-2021
- Premium Statistic Number of Ford car sales in the United States 2015-2021
- Premium Statistic Ford YTD vehicle sales in the U.S. 2018-2022
- Premium Statistic U.S. car sales - Lincoln 2013-2021
Competitors
6
Special focus on U.S consumers
7
- Premium Statistic Car brand perception survey in the United States 2023
- Premium Statistic Car quality: best brands as ranked by U.S. new car owners 2022
- Premium Statistic Most reliable car brands for safety according to U.S. car owners 2022
- Premium Statistic Social or economic factors that affect vehicle purchasing in the U.S. 2022
- Premium Statistic U.S. consumers' main concerns about BEVs 2021
- Premium Statistic Car purchasing intention in the U.S. by vehicle type and climate change views 2021
- Premium Statistic Car purchasing intention in the U.S. by vehicle type and household income 2021
Further related statistics
11
- Leading German car brands by brand value 2021
- Most prestigious car brands worldwide 2011
- Car brands based for value - car owner opinion in the U.S. 2013
- Car ownership by make / brand in Spain 2022
- Car ownership by make / brand in Turkey 2022
- Car ownership by make / brand in the UK 2022
- Car ownership by make / brand in Brazil 2022
- Car ownership by make / brand in Colombia 2022
- Top car makes by volume sales in Denmark in 2018
- Top car makes by volume sales in Greece in 2018
- Top car models by volume sales in Croatia in 2018
Further Content: You might find this interesting as well
Statistics
- Leading German car brands by brand value 2021
- Most prestigious car brands worldwide 2011
- Car brands based for value - car owner opinion in the U.S. 2013
- Car ownership by make / brand in Spain 2022
- Car ownership by make / brand in Turkey 2022
- Car ownership by make / brand in the UK 2022
- Car ownership by make / brand in Brazil 2022
- Car ownership by make / brand in Colombia 2022
- Top car makes by volume sales in Denmark in 2018
- Top car makes by volume sales in Greece in 2018
- Top car models by volume sales in Croatia in 2018
Statista. (August 29, 2018). Media value of car brands in the Netherlands in the fourth quarter of 2017 (in 1,000 euros) [Graph]. In Statista. Retrieved May 29, 2023, from https://www.statista.com/statistics/909705/media-value-car-brands-in-the-netherlands/
Statista. "Media value of car brands in the Netherlands in the fourth quarter of 2017 (in 1,000 euros)." Chart. August 29, 2018. Statista. Accessed May 29, 2023. https://www.statista.com/statistics/909705/media-value-car-brands-in-the-netherlands/
Statista. (2018). Media value of car brands in the Netherlands in the fourth quarter of 2017 (in 1,000 euros). Statista. Statista Inc.. Accessed: May 29, 2023. https://www.statista.com/statistics/909705/media-value-car-brands-in-the-netherlands/
Statista. "Media Value of Car Brands in The Netherlands in The Fourth Quarter of 2017 (in 1,000 Euros)." Statista, Statista Inc., 29 Aug 2018, https://www.statista.com/statistics/909705/media-value-car-brands-in-the-netherlands/
Statista, Media value of car brands in the Netherlands in the fourth quarter of 2017 (in 1,000 euros) Statista, https://www.statista.com/statistics/909705/media-value-car-brands-in-the-netherlands/ (last visited May 29, 2023)
Media value of car brands in the Netherlands in the fourth quarter of 2017 (in 1,000 euros) [Graph], Statista, August 29, 2018. [Online]. Available: https://www.statista.com/statistics/909705/media-value-car-brands-in-the-netherlands/