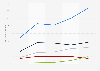
U.S. housing market - statistics & facts
Key insights
- Number of owner-occupied housing units in the U.S.
- 83.48m

Detailed statistics
Number of owner occupied homes in the U.S. 1975-2021
- Number of housing units occupied by renter in the U.S.
- 44m

Detailed statistics
Number of renter occupied homes in the U.S. 1975-2021
- U.S. homeownership rate
- 65.9%

Detailed statistics
Homeownership rate in the U.S. 1990-2022
Editor’s Picks Current statistics on this topic
Current statistics on this topic
Related topics
Recommended statistics
Residential housing market
11
- Premium Statistic Number of U.S. housing units 1975-2021
- Basic Statistic Number of owner occupied homes in the U.S. 1975-2021
- Premium Statistic Number of renter occupied homes in the U.S. 1975-2021
- Premium Statistic Homeownership rate in the U.S. 1990-2022
- Premium Statistic U.S. homeownership rate for householders over 65 years old 2011-2021
- Basic Statistic Homeowner vacancy rates in the U.S. 1990-2021
- Basic Statistic Rental vacancy rates in the U.S. 2000-2021, by region
- Premium Statistic Number of new housing units sold in the U.S. 1995-2022
- Premium Statistic Leading apartment owners in the U.S. 2022, by units owned
- Premium Statistic Leading real estate websites in the U.S. 2022, by monthly visits
- Premium Statistic U.S. National Association of Realtors: number of members 2009-2021
Residential housing market
-
Premium Statistic
Number of U.S. housing units 1975-2021
Number of housing units in the United States from 1975 to 2021 (in millions)
-
Basic Statistic
Number of owner occupied homes in the U.S. 1975-2021
Number of owner occupied housing units in the United States from 1975 to 2021 (in millions)
-
Premium Statistic
Number of renter occupied homes in the U.S. 1975-2021
Number of renter occupied housing units in the United States from 1975 to 2021 (in millions)
-
Premium Statistic
Homeownership rate in the U.S. 1990-2022
Homeownership rate in the United States from 1990 to 2022
-
Premium Statistic
U.S. homeownership rate for householders over 65 years old 2011-2021
U.S. homeownership rate for householders over 65 years old between 2011 and 2021
-
Basic Statistic
Homeowner vacancy rates in the U.S. 1990-2021
Homeowner vacancy rates in the United States from 1990 to 2021
-
Basic Statistic
Rental vacancy rates in the U.S. 2000-2021, by region
Rental vacancy rates in the United States from 2000 to 2021, by region
-
Premium Statistic
Number of new housing units sold in the U.S. 1995-2022
Number of new houses sold in the United States from 1995 to 2022 (in thousands)
-
Premium Statistic
Leading apartment owners in the U.S. 2022, by units owned
Leading apartment owners in the United States in 2022, by units owned
-
Premium Statistic
Leading real estate websites in the U.S. 2022, by monthly visits
Most popular real estate websites in the United States in 2022, based on monthly visits (in millions)
-
Premium Statistic
U.S. National Association of Realtors: number of members 2009-2021
Number of National Association of Realtors members in the United States from 2009 to 2021 (in millions)
Home building
6
- Basic Statistic Leading home builders in the U.S. 2021, by revenue
- Premium Statistic Value of new private residential construction in the U.S. 1964-2022
- Premium Statistic Number of single family building permits in the U.S. 2000-2022
- Premium Statistic Number of multifamily building permits in the U.S. 2000-2021
- Premium Statistic Single-family housing starts in the U.S. 1980-2022, with forecasts until 2024
- Premium Statistic New housing construction starts in the U.S. 1968-2023, per month
Home building
-
Basic Statistic
Leading home builders in the U.S. 2021, by revenue
Leading home builders in the United States in 2021, by gross revenue (in billion U.S. dollars)
-
Premium Statistic
Value of new private residential construction in the U.S. 1964-2022
Value of new private home construction put in place in the United States from 1964 to 2022 (in billion U.S. dollars)
-
Premium Statistic
Number of single family building permits in the U.S. 2000-2022
Number of single family building permits in the United States from 2000 to 2022 (in thousands)
-
Premium Statistic
Number of multifamily building permits in the U.S. 2000-2021
Number of multifamily building permits in the United States from 2000 to 2021 (in thousands)
-
Premium Statistic
Single-family housing starts in the U.S. 1980-2022, with forecasts until 2024
Volume of new single family home construction in the United States from 1980 to 2022, with forecasts until 2024 (in 1,000s)
-
Premium Statistic
New housing construction starts in the U.S. 1968-2023, per month
New privately-owned housing construction starts in the United States from February 1968 to March 2023 (in 1,000s)
Home financing
7
- Basic Statistic U.S. housing units for sale 1975-2022
- Basic Statistic U.S. housing: Case Shiller National Home Price Index 2000-2022
- Basic Statistic Average sales price of new homes sold in the U.S. 1965-2022
- Premium Statistic Mortgage down payment for home purchase in the U.S. 2012-2021
- Premium Statistic Median and average down payment of different types of homes in the U.S. in 2021
- Premium Statistic Median down payment of in the U.S. in 2022, by state
- Basic Statistic Number of new home sales in the U.S. 2000-2022, by financing type
Home financing
-
Basic Statistic
U.S. housing units for sale 1975-2022
Number of U.S. housing units for sale only from 1975 to 2022 (in 1,000s)
-
Basic Statistic
U.S. housing: Case Shiller National Home Price Index 2000-2022
S&P/Case Shiller U.S. National Home Price Index from 2000 to 2022
-
Basic Statistic
Average sales price of new homes sold in the U.S. 1965-2022
Average sales price of new homes sold in the United States from 1965 to 2022 (in 1,000 U.S. dollars)
-
Premium Statistic
Mortgage down payment for home purchase in the U.S. 2012-2021
Median mortgage down payment for home purchase in the United States from 2012 to 2021 (in U.S. dollars)
-
Premium Statistic
Median and average down payment of different types of homes in the U.S. in 2021
Median and average mortgage down payment in the United States in 2021, by housing type (in U.S. dollars)
-
Premium Statistic
Median down payment of in the U.S. in 2022, by state
Median down payment in the United States in 2022, by state (in U.S. dollars)
-
Basic Statistic
Number of new home sales in the U.S. 2000-2022, by financing type
Number of new house sales in the United States from 2000 to 2022, by financing type (in 1,000s)
Affordability
8
- Premium Statistic Composite housing affordability index in the U.S. 2000-2021
- Premium Statistic FMHPI house price index change 2010-2023
- Premium Statistic Main reasons for buying a home U.S. 2021
- Premium Statistic Main reasons non-owners don't currently own a home U.S. 2021
- Premium Statistic Attitude towards home buying in 2022, by generation
- Premium Statistic Annual home price appreciation in the 50 U.S. states as of Q3 2022
- Premium Statistic Home buyers who struggle finding a home due to affordability U.S. 2022, by generation
- Premium Statistic Buyers able to afford less than half of homes for sale U.S. 2020-2022, by generation
Affordability
-
Premium Statistic
Composite housing affordability index in the U.S. 2000-2021
Composite housing affordability index in the United States from 2000 to 2021
-
Premium Statistic
FMHPI house price index change 2010-2023
Freddie Mac House Price Index price appreciation from 2010 to 2023
-
Premium Statistic
Main reasons for buying a home U.S. 2021
Main reasons for purchasing a home in the United States in 2021
-
Premium Statistic
Main reasons non-owners don't currently own a home U.S. 2021
Reasons why non-owners currently do not own a home in the United States in 2021
-
Premium Statistic
Attitude towards home buying in 2022, by generation
Share of American adults who feel better or worse about their ability to buy a home in 2022 compared to 2021, by generation
-
Premium Statistic
Annual home price appreciation in the 50 U.S. states as of Q3 2022
Percentage change from previous year of single-family housing prices in the different states of the United States as of 3rd quarter 2022
-
Premium Statistic
Home buyers who struggle finding a home due to affordability U.S. 2022, by generation
Share of active home buyers who struggle finding a home due to high prices in the United States in second quarter 2020 and second quarter 2022, by generation
-
Premium Statistic
Buyers able to afford less than half of homes for sale U.S. 2020-2022, by generation
Share of adults who can afford less than 50 percent of the homes for sale in the United States from 2nd quarter 2020 to 2nd quarter 2022, by generation
Home flipping
-
Premium Statistic
Average gross profit made per home flip in the U.S. 2005-Q3 2022
Average gross profit made per home flip in the United States from 2005 to 3rd quarter 2022 (in 1,000 U.S. dollars)
-
Premium Statistic
Leading house flipping markets in the U.S. Q3 2022, by gross ROI
Leading house flipping markets in the United States in 3rd quarter 2022, by gross return on investment (ROI)
-
Premium Statistic
Number of single family homes and condos flipped in the U.S. 2000-2021
Number of single family homes and condos flipped in the United States from 1st quarter 2000 to 2nd quarter 2021
Reports & StudiesGet the best reports to understand your industry
Get the best reports to understand your industry
Contact

Mon - Fri, 9am - 6pm (EST)

Mon - Fri, 9am - 5pm (SGT)

Mon - Fri, 10:00am - 6:00pm (JST)

Mon - Fri, 9:30am - 5pm (GMT)

Mon - Fri, 9am - 6pm (EST)