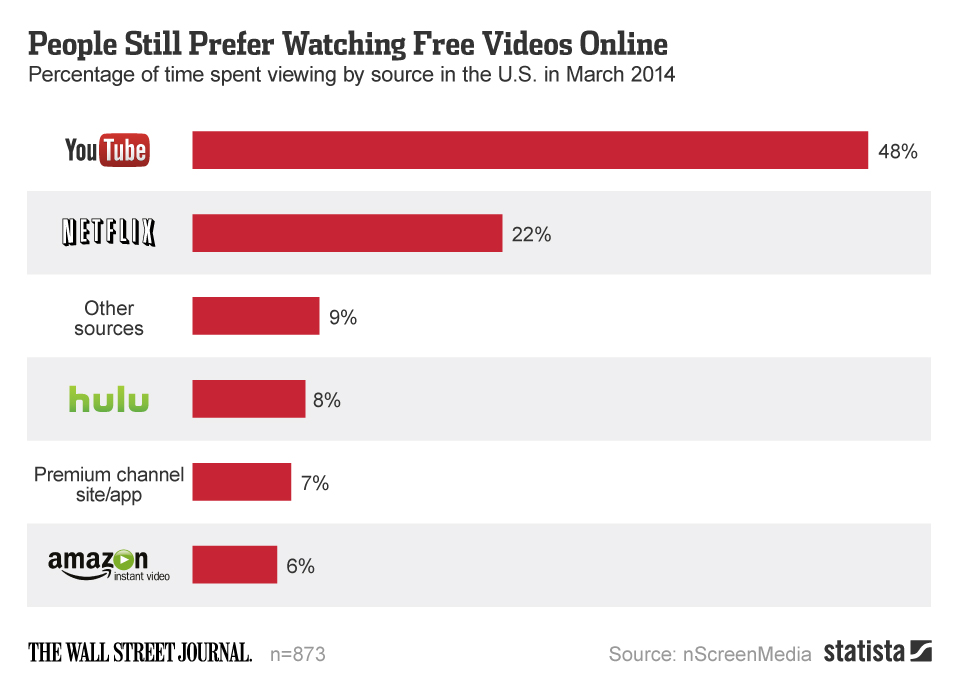
Even though paid streaming video services are booming, they're still playing second fiddle to free platforms like YouTube. According to nScreenMedia, people spent an impressive 48 percent of their time watching online video on YouTube in March 2014. Netflix accounted for 22 percent of people's time while Hulu came in with just 8 percent.
People Still Prefer Watching Free Videos Online

Description
This chart shows the percentage of time spent viewing by source in the U.S. in March 2014.