Skip to main content
Consumer Goods & FMCG
E-Commerce
Economy & Politics
Energy & Environment
Health, Pharma & Medtech
Internet
Media
Technology & Telecommunications
Transportation & Logistics
Travel, Tourism & Hospitality
View all industries
Global data volume growth
Global AI market size
Number of generative AI users worldwide
Global inflation rate
Retail e-commerce sales worldwide
Largest economies worldwide
Biggest social media platforms by users
Global EV market share by manufacturer
International tourist arrivals by world region
Global annual CO₂ emissions
Browse recent statistics
Artificial intelligence (AI) worldwide
TikTok
Nvidia
E-commerce worldwide
Global GDP
Instagram
Apparel market worldwide
Video gaming worldwide
Global renewable energy industry
Influencer marketing worldwide
Browse recent topics
Consumer Trends 2026
Artificial Intelligence: in-depth market analysis
E-commerce challenges
Global economy
TikTok
Luxury goods: in-depth market analysis
Electric vehicles: A global overview
Video gaming worldwide
Travel and tourism trends 2026
Battery recycling worldwide
Browse recent reports
Explore the tool
Explore Classic mode
Advertising & Media
eCommerce
Consumer
Finance
Global Indicators
Health
Industrial
Mobility
Technology
Explore Market Insights
eCommerce Insights
Research AI
Book a demo
All integrations
Developer docs
Explore Statista Connect
Research
Strategy & Consulting
Marketing
Media & PR
Explore AI assistants
Marketing
Research & Development
Strategy
Sales
Find the fact
Tell the story
Win the pitch
Understand the market
Develop your strategy
Academia
Agencies
Consultancies
Consumer goods
Finance
Tech
Research solutions
Strategy consulting
Communication services
Explore Statista+
Statista R
Statista Healthcare
About Statista
First steps & help center
Webinar & training hub
Success stories
Individuals & Small Teams
Businesses & Enterprises
Academia & Government
English
Deutsch
Daily Data
Infographics on the topic " rel="
Pollution
Dec 9, 2019
This chart shows megatonnes of CO2 equivalent produced in 2018.
More Information
Germany
Dec 9, 2019
This chart shows average life expectancy in German federal states by gender (years).
More Information
Uber
Dec 9, 2019
This chart shows reported incidents of sexual assault received by Uber in the U.S.
More Information
World Leaders
Dec 9, 2019
This chart shows the youngest elected state leaders worldwide as of December 2019.
More Information
Brexit
Dec 9, 2019
This chart shows how EU citizens living in the UK would vote in the 2019 general election.
More Information
Dentist
Dec 6, 2019
This chart shows the average number of dental consultations per inhabitant in 2017.
More Information
Extreme Weather Events
Dec 6, 2019
This chart shows annual average fatalities per 100,000 inhabitants due to extreme weather events from 1998 to 2017.
More Information
Cinema
Dec 5, 2019
This chart shows the % of the UK public considering the following their favourite Bond actor (April 2019).
More Information
Soccer
Dec 5, 2019
This chart shows commissions by agents/intermediaries involved in international soccer transfers.
More Information
Parental Leave
Dec 5, 2019
This chart shows the % of U.S. parents who took parental leave and who were fully, partly or not paid in 2019.
More Information
Potatoes
Dec 4, 2019
This chart shows U.S. potato production by year (1,000 cwt).
More Information
Energy
Dec 4, 2019
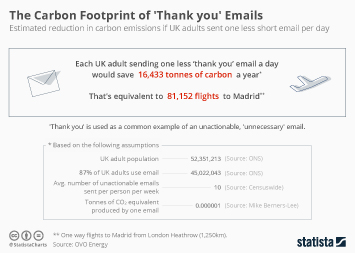
This chart shows the estimated reduction in carbon emissions if UK adults sent one less short email per day.
More Information
Twitter
Dec 3, 2019
This chart shows the number of times @realdonaldtrump tweeted using the following nicknames for selected figures*.
More Information
Climate
Dec 3, 2019
This chart shows the deviation of annual mean surface temperature of the Earth from the 1951-1980 average.
More Information
Firearms
Dec 3, 2019
This chart shows the average price of an M16A2/A4 assault rifle in selected countries/regions in late 2019*.
More Information
Rail Travel
Dec 2, 2019
This chart shows a breakdown of how money made via rail fares is spent in Great Britain.
More Information
Employment
Dec 2, 2019
This chart shows the average annual number of strike days per 1,000 employees in selected OECD countries.
More Information
Socialism
Dec 2, 2019
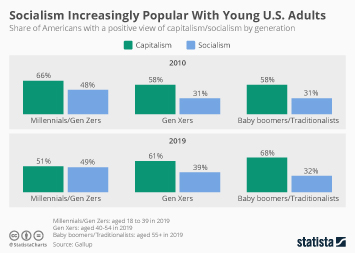
This chart shows the share of Americans with a positive view of capitalism/socialism by generation.
More Information
Health Service
Nov 28, 2019
This chart shows responses in the UK to the following statement: 'I am worried about how a trade deal with the US could impact the...
More Information
Employment
Nov 27, 2019
This chart shows a distribution of persons employed in the European Union in 2016, by enterprise size.
More Information
Social Media
Nov 27, 2019
This chart compares the number of Twitter followers of Donald Trump und selected Democratic 2020 candidates.
More Information
UK Election
Nov 27, 2019
This chart compares UK voter registration applications from the day of elections being called to the registration deadlines.
More Information
UK Election
Nov 27, 2019
This chart shows the number of voter registration applications in the United Kingdom from 29 October to 26 November 2019, by age group.
More Information
Employment
Nov 25, 2019
This infographic shows the average annual gross pay of UK employees in the top earning percentiles in 2019.
More Information
Germany
Nov 25, 2019
This chart shows the number of female victims of domestic violence in Germany.
More Information
Election 2019
Nov 25, 2019
This chart shows general election voting intention for selected parties in Great Britain, by age group in November 2019.
More Information
Germany
Nov 22, 2019
This chart shows household income in selected German cities in 2016.
More Information
Pickup Trucks
Nov 22, 2019
This chart shows U.S. sales of new pickup trucks in 2019 (January to September).
More Information
Health
Nov 22, 2019
This chart shows the estimated prevalence of insufficient physical activity among 11-17 year olds.
More Information
UK Election
Nov 22, 2019
This chart breaks down the expected Income raised by 2023-24 through tax measures proposed in the 2019 Labour manifesto.
More Information
2
/
8
Contact
Get in touch with us. We are happy to help.
Do you still have questions?
Feel free to contact us anytime using our
contact form
or visit our
FAQ page
.
Your contact to the Infographics Newsroom
Felix Richter
Data Journalist
felix.richter@statista.com
+49 (40) 284 841 557