Skip to main content
Consumer Goods & FMCG
E-Commerce
Economy & Politics
Energy & Environment
Health, Pharma & Medtech
Internet
Media
Technology & Telecommunications
Transportation & Logistics
Travel, Tourism & Hospitality
View all industries
Global data volume growth
Global AI market size
Number of generative AI users worldwide
Global inflation rate
Retail e-commerce sales worldwide
Largest economies worldwide
Biggest social media platforms by users
Global EV market share by manufacturer
International tourist arrivals by world region
Global annual CO₂ emissions
Browse recent statistics
Artificial intelligence (AI) worldwide
TikTok
Nvidia
E-commerce worldwide
Global GDP
Instagram
Apparel market worldwide
Video gaming worldwide
Global renewable energy industry
Influencer marketing worldwide
Browse recent topics
Consumer Trends 2026
Artificial Intelligence: in-depth market analysis
E-commerce challenges
Global economy
TikTok
Luxury goods: in-depth market analysis
Electric vehicles: A global overview
Video gaming worldwide
Travel and tourism trends 2026
Battery recycling worldwide
Browse recent reports
Explore the tool
Explore Classic mode
Advertising & Media
eCommerce
Consumer
Finance
Global Indicators
Health
Industrial
Mobility
Technology
Explore Market Insights
eCommerce Insights
Research AI
Book a demo
All integrations
Developer docs
Explore Statista Connect
Research
Strategy & Consulting
Marketing
Media & PR
Explore AI assistants
Marketing
Research & Development
Strategy
Sales
Find the fact
Tell the story
Win the pitch
Understand the market
Develop your strategy
Academia
Agencies
Consultancies
Consumer goods
Finance
Tech
Research solutions
Strategy consulting
Communication services
Explore Statista+
Statista R
Statista Healthcare
About Statista
First steps & help center
Webinar & training hub
Success stories
Individuals & Small Teams
Businesses & Enterprises
Academia & Government
English
Deutsch
Daily Data
Infographics on the topic " rel="
Air Travel
Nov 22, 2019
This chart shows involuntary denied boardings per 100,000 passengers in 2018.
More Information
Economy
Nov 21, 2019
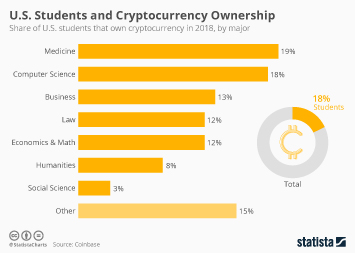
This chart shows the share of U.S. students that own cryptocurrency in 2018, by major.
More Information
Health in the UK
Nov 21, 2019
This chart shows the share that have taken prescribed medicines in the last week in England, by amount and age group.
More Information
2020
Nov 21, 2019
This chart shows the minutes spoken in the November 20 televised Democratic debate.
More Information
Donkeys
Nov 21, 2019
This chart shows the change in donkey population in selected countries.
More Information
Global Terrorism Index
Nov 21, 2019
This chart shows total terrorism deaths by county.
More Information
Terrorism
Nov 20, 2019
This chart shows economic losses due to terrorism from 2000 to 2018 (billion U.S. dollars).
More Information
UK Politics
Nov 20, 2019
This chart shows the UK public's reaction to the 19 November ITV election debate.
More Information
Premier League
Nov 20, 2019
This chart illustrates the major honours won by Tottenham Hotspur and José Mourinho from 07/08 to 18/19.
More Information
Migration
Nov 20, 2019
This chart shows the number of children in migrant-related detention worldwide in 2018.
More Information
Germany
Nov 19, 2019
This chart shows the share of the population aged 15+ who smoked in German federal states in 2017.
More Information
Drones
Nov 19, 2019
This chart shows the total forecast purchases of weaponized military drones up to 2028.
More Information
UK Politics
Nov 19, 2019
This chart shows the share saying they would vote for the Brexit Party in a general election over the course of 2019.
More Information
Vaccinations
Nov 19, 2019
This chart shows the percentage point difference in vaccinated kindergartners (2009 vs 2018).
More Information
Germany
Nov 18, 2019
This chart shows the level of packaging consumption in Germany by material (million tonnes).
More Information
Travel
Nov 18, 2019
This chart shows global locations by risk level in 2019.
More Information
Banking
Nov 18, 2019
This chart shows the number of bankers who earned €1 million or more by country in 2017.
More Information
Healthcare
Nov 15, 2019
This chart shows the share of Americans knowing a friend/family member who died due to their inability to pay for medical treatment....
More Information
Terrorism
Nov 14, 2019
This chart shows the race/ethnicity of lone offender terrorists in the U.S. from 1972 to 2015.
More Information
Recycling
Nov 14, 2019
This chart shows the types of waste people in the U.S. were recycling in 2017.
More Information
Immigration
Nov 14, 2019
This chart shows index scores for immigrant integration in U.S. cities in 2019 (5 = best integration).
More Information
Italy
Nov 13, 2019
This chart shows the maximum documented tide levels in Venice (cm).
More Information
Chelsea
Nov 13, 2019
This chart shows Chelsea's leaked internal player fines for the 2019-20 season (GBP).
More Information
Environment
Nov 12, 2019
This chart reveals the European countries with the most carbon dioxide equivalent air emissions in 2017.
More Information
Dolphins
Nov 12, 2019
This chart shows countries by number of dolphins in captivity in 2019.
More Information
Germany
Nov 12, 2019
This chart shows the estimated number of homeless people in Germany by year.
More Information
2020 Presidential Election
Nov 12, 2019
% confident the U.S. can defend against foreign government interference in the 2020 election.
More Information
UK Election
Nov 12, 2019
This chart shows how people in Britain feel about the upcoming 2019 election.
More Information
Global Warming
Nov 12, 2019
This chart shows the total number of heat stroke/exhaustion cases in the U.S. military by year.
More Information
Video Games
Nov 11, 2019
This chart shows the Twitch accounts of individuals with the most followers as of 7 November 2019.
More Information
Energy
Nov 11, 2019
This chart shows electricity consumption in 2017 (MWh per capita).
More Information
Apps
Nov 8, 2019
This chart shows the share of U.S. smartphone users saying they spend the most time on the following app types.
More Information
Motorists
Nov 8, 2019
This chart shows the top cited 'most annoying' behaviours by drivers in the UK in 2019.
More Information
Employment
Nov 8, 2019
This chart shows the most commonly cited reasons for days lost through sickness absence in the UK in 2018.
More Information
CO2 Emissions
Nov 7, 2019
This chart shows the annual percentage change in greenhouse gas emissions (2018).
More Information
Disposable Income
Nov 7, 2019
This chart shows the EU regions with the highest & lowest annual disposable income per inhabitant
More Information
Hearables
Nov 6, 2019
This chart shows estimated global shipments of enhanced earworn devices.
More Information
Germany
Nov 6, 2019
This chart shows life satisfaction in Germany by region in 2019.
More Information
Syria
Nov 6, 2019
This chart shows the targets of RAF air attacks against ISIS in Iraq & Syria (Oct 17-Sep 19).
More Information
Headphone Market
Nov 6, 2019
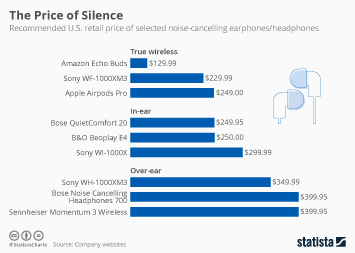
This chart shows the recommended U.S. retail price of selected noise-cancelling earphones/headphones.
More Information
Plastic
Nov 6, 2019
This chart shows index scores for single-use plastic in supermarket chains.
More Information
Impeachment
Nov 6, 2019
This chart shows support for impeachment and removal of Richard Nixon & Donald Trump, by political party.
More Information
Global Climate Change
Nov 5, 2019
An infographic displaying a variety of facts concerning the melting of the Greenland ice sheet
More Information
Car Theft
Nov 5, 2019
This chart shows police-recorded thefts of motorized vehicles per 100,000 inhabitants in the EU (2015-2017).
More Information
Environment
Nov 4, 2019
This chart shows the countries with the most estimated years of life expectancy lost due current air pollution levels in 2019.
More Information
Politics
Nov 1, 2019
This chart is a collection of the most recent voting intention polls in Great Britain as of 1 November 2019.
More Information
30th anniversary fall of Berlin Wall
Nov 1, 2019
This chart shows the number of fatalities at the Berlin Wall from 1961 to 1989.
More Information
Brexit
Oct 30, 2019
This chart gives an overview of the key parliamentary votes in which Boris Johnson and his government were considered defeated.
More Information
U.S. Politics
Oct 30, 2019
This chart shows the most recent impeachment polling in the United States as of October 30, 2019.
More Information
Finance
Oct 30, 2019
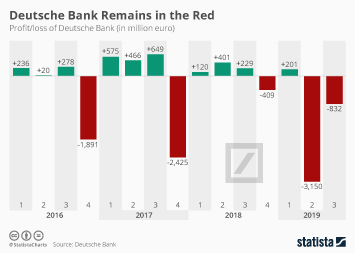
This chart shows the quarterly profit/loss of Deutsche Bank from 2016 to 2019.
More Information
Halloween
Oct 30, 2019
This chart shows key retail facts about Halloween in 2019.
More Information
Internet
Oct 29, 2019
This chart shows the most popular worldwide search queries on Bing in 2019.
More Information
Religion
Oct 29, 2019
This chart shows the number of Catholic priests in the United States and worldwide from 1970 to 2018.
More Information
Witch Trials
Oct 29, 2019
This chart shows people tried and executed in witch trials in Europe between 1300 and 1850.
More Information
Instagram
Oct 29, 2019
This chart shows celebrities ranked by their annual average income from Instagram (million U.S. dollars).
More Information
Survey
Oct 28, 2019
This chart shows who Americans think are the "biggest threats to world peace" in 2019.
More Information
Ad Spend
Oct 28, 2019
This chart shows global/mobile ad spending distribution by platform.
More Information
Health
Oct 28, 2019
This chart shows index scores by level of preparation to respond to an epidemic/pandemic.
More Information
Germany
Oct 28, 2019
This chart shows the results of previous state elections in Thuringia by year.
More Information
Brexit
Oct 25, 2019
This chart shows the share of GB adults that support or oppose calling an immediate general election.
More Information
Germany
Oct 25, 2019
This chart shows Sonntagsfrage polling on Thuringia's state election in percent.
More Information
Business
Oct 25, 2019
This chart shows index scores based on each economy's ease of doing business (100=easiest).
More Information
Democratic Race
Oct 24, 2019
This chart show the share of Democrats who would vote for the following in the 2020 primary.
More Information
Discrimination
Oct 24, 2019
This chart shows discrimination experienced by respondents (personally or as a witness) in the workplace (%).
More Information
Tesla
Oct 24, 2019
This chart shows Tesla's quarterly revenues and net income/loss.
More Information
Sponsored Post
Oct 24, 2019
The infographic shows data about Berlin blockchain startups
More Information
University Research Funding
Oct 24, 2019
This chart shows government funding for university R&D as a share of GDP in 2017.
More Information
Boeing
Oct 24, 2019
This chart shows Boeing's net earnings/losses by quarter (in million U.S. dollars).
More Information
Netflix Value
Oct 23, 2019
This chart shows the average cost per title in U.S. dollars for a monthly Netflix subscription.
More Information
Digital Advertising
Oct 23, 2019
Second Quarter advertising revenue by channel in billions of USD.
More Information
Immigration
Oct 23, 2019
This chart shows the number of pending deportation cases in the U.S. by fiscal year.
More Information
Brexit
Oct 23, 2019
This chart shows the share of the UK's public approving of British and EU leadership.
More Information
Renewable Energy
Oct 22, 2019
This chart shows the renewable capacity growth estimates between 2019 and 2024 in gigawatts.
More Information
Hunting
Oct 22, 2019
This chart shows the number of hunters per 1,000 inhabitants in selected European countries in 2018.
More Information
Cristiano Ronaldo
Oct 22, 2019
This chart shows Cristiano Ronaldo's annual Instagram earnings and salary at Juventus in 2019.
More Information
Millionaires
Oct 22, 2019
This chart shows countries by the number of dollar millionaires in 2019.
More Information
United Kingdom
Oct 22, 2019
This flow chart covers potential Brexit scenarios and likely outcomes after the vote on the Brexit deal on 22 October 2019.
More Information
Demographics
Oct 22, 2019
This chart shows UK population mid-year estimates and projections from 1993 to 2043.
More Information
Politics
Oct 22, 2019
This chart shows the seats won in the 2019 Canadian federal election, by party.
More Information
Gun Sales
Oct 22, 2019
This chart shows estimated gun sales per 1,000 adults in U.S. states in 2018.
More Information
Air Travel Emissions
Oct 22, 2019
This chart shows the estimated global share of commercial air travel CO2 emissions in 2018.
More Information
Tech
Oct 21, 2019
This chart shows the percent of people who are optimistic about effects of tech on society.
More Information
World Governments
Oct 21, 2019
This chart shows the share of countries under each regime type, 1946-2017.
More Information
Aviation
Oct 21, 2019
This infographic charts the monthly orders of the Boeing 737 Max.
More Information
UK
Oct 21, 2019
This chart shows public opinion on the Brexit deal negotiated by the Boris Johnson government in October 2019.
More Information
Opioid Crisis
Oct 21, 2019
This chart shows the estimated cost of the U.S. opioid crisis by category from 2015 to 2018.
More Information
Digital Media
Oct 18, 2019
This chart shows the revenue of the digital media market in selected countries in 2023 (in billion U.S. dollars).
More Information
Retail Sales
Oct 18, 2019
This chart shows the percent change in monthly U.S. retail sales growth between 2018 and 2019.
More Information
Christianity
Oct 17, 2019
This chart shows the share of the U.S. population identifying as Christian.
More Information
United Kingdom
Oct 17, 2019
This chart shows public opinion on how UK party leaders are handling Brexit.
More Information
3
/
8
Contact
Get in touch with us. We are happy to help.
Do you still have questions?
Feel free to contact us anytime using our
contact form
or visit our
FAQ page
.
Your contact to the Infographics Newsroom
Felix Richter
Data Journalist
felix.richter@statista.com
+49 (40) 284 841 557