Skip to main content
Consumer Goods & FMCG
E-Commerce
Economy & Politics
Energy & Environment
Health, Pharma & Medtech
Internet
Media
Technology & Telecommunications
Transportation & Logistics
Travel, Tourism & Hospitality
View all industries
Global data volume growth
Global AI market size
Number of generative AI users worldwide
Global inflation rate
Retail e-commerce sales worldwide
Largest economies worldwide
Biggest social media platforms by users
Global EV market share by manufacturer
International tourist arrivals by world region
Global annual CO₂ emissions
Browse recent statistics
Artificial intelligence (AI) worldwide
TikTok
Nvidia
E-commerce worldwide
Global GDP
Instagram
Apparel market worldwide
Video gaming worldwide
Global renewable energy industry
Influencer marketing worldwide
Browse recent topics
Consumer Trends 2026
Artificial Intelligence: in-depth market analysis
E-commerce challenges
Global economy
TikTok
Luxury goods: in-depth market analysis
Electric vehicles: A global overview
Video gaming worldwide
Travel and tourism trends 2026
Battery recycling worldwide
Browse recent reports
Explore the tool
Explore Classic mode
Advertising & Media
eCommerce
Consumer
Finance
Global Indicators
Health
Industrial
Mobility
Technology
Explore Market Insights
eCommerce Insights
Research AI
Book a demo
All integrations
Developer docs
Explore Statista Connect
Research
Strategy & Consulting
Marketing
Media & PR
Explore AI assistants
Marketing
Research & Development
Strategy
Sales
Find the fact
Tell the story
Win the pitch
Understand the market
Develop your strategy
Academia
Agencies
Consultancies
Consumer goods
Finance
Tech
Research solutions
Strategy consulting
Communication services
Explore Statista+
Statista R
Statista Healthcare
About Statista
First steps & help center
Webinar & training hub
Success stories
Individuals & Small Teams
Businesses & Enterprises
Academia & Government
English
Deutsch
Daily Data
Infographics on the topic "coronavirus"
Sponsored post by Booking.com
Dec 12, 2025
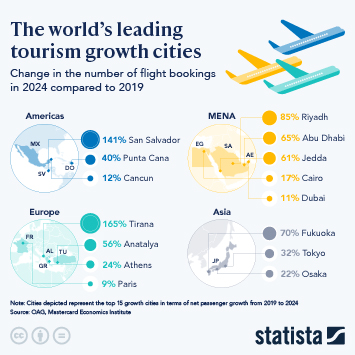
This infographic shows the change in number of flight bookings in 2024 compared to 2019.
More Information
Health
Nov 19, 2025
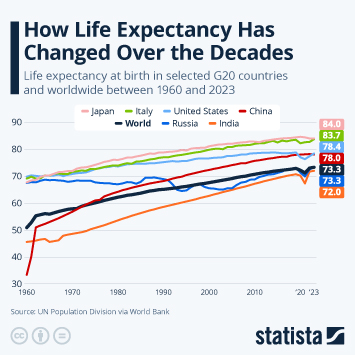
This infographic shows life expectancy at birth in selected G20 countries and worldwide between 1960 and 2023.
More Information
Food Security
Nov 10, 2025
This chart shows the share of respondents that consider food and water supply one of the biggest challenges of their country.
More Information
Emissions
Nov 7, 2025
This chart shows the total greenhouse gas emissions worldwide in 2024, by sector.
More Information
Chinese Espionage
Nov 3, 2025
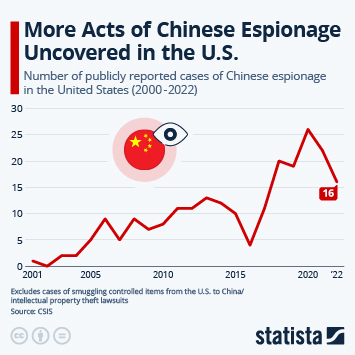
This chart shows the number of publicly reported cases of Chinese espionage in the United States (2000-2022).
More Information
Health
Oct 24, 2025
This chart shows the number of polio cases recorded worldwide since 2001.
More Information
Sponsored post by Booking.com
Oct 17, 2025
This infographic shows the share of global travelers who find flying stressful, by stress factor.
More Information
COVID-19 Deaths
Oct 15, 2025
This chart shows the countries with the highest number of deaths from COVID-19.
More Information
Investing
Oct 8, 2025
This chart shows the percentage of U.S. adults saying each of the following is the best long-term investment solution.
More Information
IT Outsourcing
Sep 10, 2025
This chart shows the worldwide revenue of IT outsourcing (in billion U.S. dollars).
More Information
NATO
Sep 2, 2025
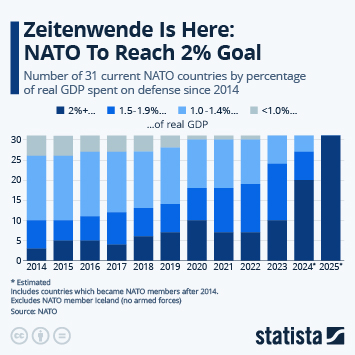
This chart shows the number of 31 current NATO countries by percentage of real GDP spent on defense since 2014.
More Information
UN SDGs
Aug 7, 2025
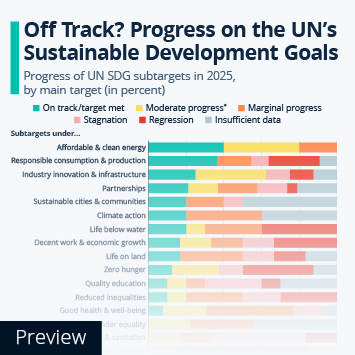
This chart shows the progress of UN SDG subtargets in 2025, by main target (in percent).
More Information
Renewable Energy
Aug 7, 2025
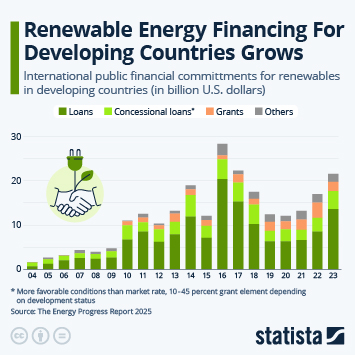
This chart shows international public financial committments for renewables in developing countries (in billion U.S. dollars).
More Information
U.S. GDP
Jul 31, 2025
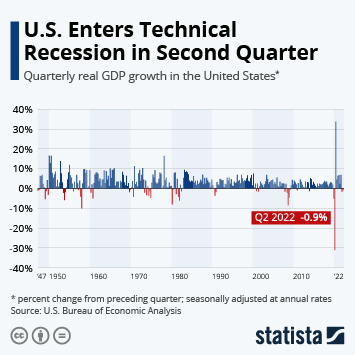
This chart shows quarterly real GDP growth in the United States since 2007.
More Information
Inflation
Jul 30, 2025
This chart shows projected annual inflation by country in 2025.
More Information
Food Prices
Jul 29, 2025
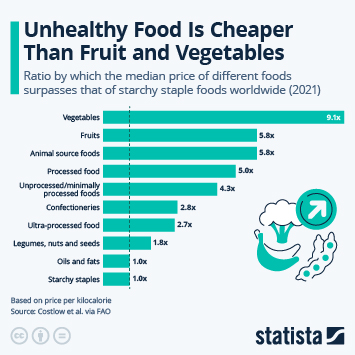
This chart shows the ratio by which the median price of different foods surpasses that of starchy staple foods worldwide (2021).
More Information
Japan Election
Jul 21, 2025
This chart shows the initial approval ratings of the Liberal Democratic Party cabinets in Japan.
More Information
Vaccination
Jul 18, 2025
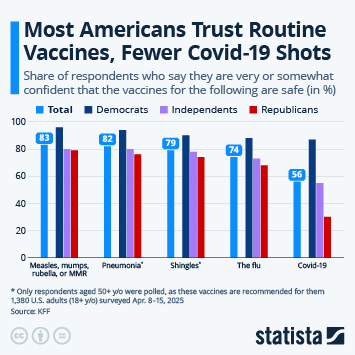
This chart shows how the share of respondents who say they are very or somewhat confident that various vaccines are safe.
More Information
Smoking
Jul 2, 2025
This chart shows major tobacco bans or similar legislation and state of implementation worldwide (as of July 2025).
More Information
Loneliness
Apr 30, 2025
This chart shows the share of respondents who feel fairly or very lonely, by age range.
More Information
Manufacturing
Apr 16, 2025
This chart shows the top 10 countries by share of global manufacturing output in 2023.
More Information
Stock market
Apr 7, 2025
This chart puts some of the largest downturns of the S&P 500 into perspective by looking at its long-term perfomance.
More Information
Covid 5 year anniversary
Mar 11, 2025
This chart shows the share of U.S. adults who have had/are experiencing long covid, as a percentage of all U.S. adults.
More Information
covid
Mar 11, 2025
This chart shows which groups are more likely to experience long Covid in the U.S.
More Information
Covid-19
Mar 11, 2025
This chart shows the deadliest pandemics/epidemics worldwide by estimated number of victims.
More Information
Vaccination
Mar 6, 2025
This chart compares annual 20th century morbidity for selected vaccine-preventable diseases to current (2023) morbidity in the U.S.
More Information
Music streaming
Feb 7, 2025
This chart shows the profitability development of Spotify.
More Information
Video
Feb 4, 2025
This chart shows the share of U.S. respondents who used the following video formats in the past 12 months (in percent).
More Information
Boeing and Airbus
Jan 15, 2025
This chart shows the quarterly net profit/loss of The Boeing Company and Airbus (in million U.S. dollars).
More Information
Volkswagen Group
Jan 14, 2025
This chart shows the annual deliveries by Volkswagen Group, by make/brand.
More Information
2
/
15
Contact
Get in touch with us. We are happy to help.
Do you still have questions?
Feel free to contact us anytime using our
contact form
or visit our
FAQ page
.
Your contact to the Infographics Newsroom
Felix Richter
Data Journalist
felix.richter@statista.com
+49 (40) 284 841 557