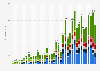
The global average volume per capita in the 'Headphones' segment of the consumer electronics market was forecast to continuously increase between 2024 and 2029 by in total 0.02 pieces (+13.33 percent). The indicator is estimated to amount to 0.17 pieces in 2029.
Data provided by Statista Market Insights are estimates.
Definition:
Headphones are a type of audio device that can be worn on the head or around the neck. They contain speakers inside the ear cups that are positioned close to the ears, enabling individuals to listen to audio content without disturbing others in their surroundings. There are several types of headphones, including over-ear headphones, on-ear headphones, and in-ear headphones (also known as earbuds). Headphones can also be classified into wired or wireless, and some models offer noise cancelling technology, which blocks out background noise. They can be used for a variety of purposes, including music listening, watching movies and videos, gaming, and making phone calls.
Additional Information:
The market comprises revenue, average revenue per capita, volume, average volume per capita and price. Figures are generated through both online and offline sales channels and include spending by consumers (B2C). Key players in the market are companies such as Samsung, LG, and Sony. These companies are leaders in their respective segments and are known for their innovative products, brand reputation, and extensive distribution networks. For more information on the data displayed, use the info button right next to the boxes.
Profit from the additional features of your individual account
Currently, you are using a shared account. To use individual functions (e.g., mark statistics as favourites, set
statistic alerts) please log in with your personal account.
If you are an admin, please authenticate by logging in again.
Learn more about how Statista can support your business.
Statista. (June 28, 2024). Per-capita sales volume of headphones worldwide from 2019 to 2029 [Graph]. In Statista. Retrieved July 27, 2024, from https://www.statista.com/forecasts/1284284/sales-volume-per-capita-headphones-market-worldwide
Statista. "Per-capita sales volume of headphones worldwide from 2019 to 2029." Chart. June 28, 2024. Statista. Accessed July 27, 2024. https://www.statista.com/forecasts/1284284/sales-volume-per-capita-headphones-market-worldwide
Statista. (2024). Per-capita sales volume of headphones worldwide from 2019 to 2029. Statista. Statista Inc.. Accessed: July 27, 2024. https://www.statista.com/forecasts/1284284/sales-volume-per-capita-headphones-market-worldwide
Statista. "Per-capita Sales Volume of Headphones Worldwide from 2019 to 2029." Statista, Statista Inc., 28 Jun 2024, https://www.statista.com/forecasts/1284284/sales-volume-per-capita-headphones-market-worldwide
Statista, Per-capita sales volume of headphones worldwide from 2019 to 2029 Statista, https://www.statista.com/forecasts/1284284/sales-volume-per-capita-headphones-market-worldwide (last visited July 27, 2024)
Per-capita sales volume of headphones worldwide from 2019 to 2029 [Graph], Statista, June 28, 2024. [Online]. Available: https://www.statista.com/forecasts/1284284/sales-volume-per-capita-headphones-market-worldwide