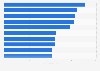
Average revenue per unit (ARPU) in the Games market Norway 2019-2029
Over the last two observations, the arpu is forecast to significantly increase in all segments. Concerning the ten selected segments, the segment In-game Advertising has the largest arpu with 70.91 U.S. dollars. Contrastingly, Physically Sold Video Games is ranked last, with 32.97 U.S. dollars. Their difference, compared to In-game Advertising, lies at 37.94 U.S. dollars.
The Statista Market Insights cover a broad range of additional markets.
The Statista Market Insights cover a broad range of additional markets.