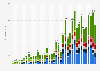
This statistic shows the annual revenue of the motion picture and sound recording and broadcasting industry in the United States from 2008 to 2013, with a forecast until 2018. In 2011, the revenue of motion pictures and sound recording and broadcasting in the U.S. ranged at approximately 208.41 billion U.S. dollars.
Revenue of the motion picture and sound recording and broadcasting industry (NAICS 512-515) in the United States from 2008 to 2018
(in million U.S. dollars)
Methodology and further information: Historic data were retrieved from the United States Census Bureau up until 2013. All forecasts rely on sophisticated statistical modelling conducted by Statista Research & Analysis. Forecast methods include trend analysis and linear regressions under consideration of relevant market drivers.
Revenue includes revenue from all business activities. It does not include sales and other taxes collected from customers and paid directly by a firm to a local, state, or federal tax agency.
More information on market forecasts on Statista can be found here.
Profit from the additional features of your individual account
Currently, you are using a shared account. To use individual functions (e.g., mark statistics as favourites, set
statistic alerts) please log in with your personal account.
If you are an admin, please authenticate by logging in again.
Learn more about how Statista can support your business.
Statista. (July 1, 2014). Revenue of the motion picture and sound recording and broadcasting industry (NAICS 512-515) in the United States from 2008 to 2018 (in million U.S. dollars) [Graph]. In Statista. Retrieved September 19, 2024, from https://www.statista.com/forecasts/311147/us-motion-picture-and-sound-recording-and-broadcasting-industry-revenue-forecast-naics-512-515
Statista. "Revenue of the motion picture and sound recording and broadcasting industry (NAICS 512-515) in the United States from 2008 to 2018 (in million U.S. dollars)." Chart. July 1, 2014. Statista. Accessed September 19, 2024. https://www.statista.com/forecasts/311147/us-motion-picture-and-sound-recording-and-broadcasting-industry-revenue-forecast-naics-512-515
Statista. (2014). Revenue of the motion picture and sound recording and broadcasting industry (NAICS 512-515) in the United States from 2008 to 2018 (in million U.S. dollars). Statista. Statista Inc.. Accessed: September 19, 2024. https://www.statista.com/forecasts/311147/us-motion-picture-and-sound-recording-and-broadcasting-industry-revenue-forecast-naics-512-515
Statista. "Revenue of The Motion Picture and Sound Recording and Broadcasting Industry (Naics 512-515) in The United States from 2008 to 2018 (in Million U.S. Dollars)." Statista, Statista Inc., 1 Jul 2014, https://www.statista.com/forecasts/311147/us-motion-picture-and-sound-recording-and-broadcasting-industry-revenue-forecast-naics-512-515
Statista, Revenue of the motion picture and sound recording and broadcasting industry (NAICS 512-515) in the United States from 2008 to 2018 (in million U.S. dollars) Statista, https://www.statista.com/forecasts/311147/us-motion-picture-and-sound-recording-and-broadcasting-industry-revenue-forecast-naics-512-515 (last visited September 19, 2024)
Revenue of the motion picture and sound recording and broadcasting industry (NAICS 512-515) in the United States from 2008 to 2018 (in million U.S. dollars) [Graph], Statista, July 1, 2014. [Online]. Available: https://www.statista.com/forecasts/311147/us-motion-picture-and-sound-recording-and-broadcasting-industry-revenue-forecast-naics-512-515