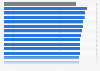
According to a 2019 survey, the most popular hot drink among Australians was coffee, with the most respondents from four out of five generations choosing it as their most consumed beverage. For respondents from Generation Z, tea was the most drunk; 32.3 percent said they consumed some during an average week.
Share of hot drinks consumed per week in Australia in 2019, by generation
Basic Account
Get to know the platform
You only have access to basic statistics.
This statistic is not included in your account.
Starter Account
The ideal entry-level account for individual users
- Instant access to 1m statistics
- Download in XLS, PDF & PNG format
- Detailed references
$59 USD $39 USD / Month *
in the first 12 months
Professional Account
Full access
Business Solutions including all features.
* Prices do not include sales tax.
Statistics on Coffee market in Australia
Overview
4
Imports and exports
6
- Premium Statistic Roast and ground coffee imports of Australia from FY 2014-FY 2022
- Premium Statistic Coffee bean imports of Australia from FY 2014-2020
- Premium Statistic Value of exported coffee in Australia 2019, by product type
- Premium Statistic Value of imported coffee in Australia 2019, by product type
- Premium Statistic Share of roasted coffee beans imported Australia 2019, by country of origin
- Premium Statistic Share of unroasted coffee beans imported Australia 2019, by country of origin
Café and coffee shop industry
6
- Premium Statistic Number of cafés and restaurants Australia 2022, by turnover
- Premium Statistic Number of cafés and restaurants in operation Australia 2017-2022
- Premium Statistic Annual revenue of cafés, restaurants and takeaway food services Australia 2004-2022
- Premium Statistic EBITDA of Retail Food Group FY 2015-2022
- Premium Statistic Social media presence of leading coffee franchises in Australia 2020, by platform
- Premium Statistic Number of Retail Food Group franchises operating Australia 2021, by brand
Pricing and sales
7
- Premium Statistic Average price of a coffee beverage sold Australia 2019, by type
- Premium Statistic Share of flat white cup sales Australia 2018 by state
- Premium Statistic Average price of a latte cup sold Australia 2019 by state
- Premium Statistic Number of hot drinks sold Retail Food Group franchises in 2020, by brand
- Basic Statistic Online grocery purchase increase in Australia 2020, by product
- Premium Statistic Cups sold in coffee bars and cafés Australia 2019 by type
- Premium Statistic Groceries & beverages purchased online by category in Australia 2022
Brands and consumer behavior
5
- Basic Statistic Coffee consumption at home during COVID-19 in March 2020 by type
- Premium Statistic Leading coffee and tea brands on YouTube Australia 2019 by total uploaded video views
- Premium Statistic Hot drink consumption by generation in Australia 2019
- Premium Statistic Household appliances ownership in Australia 2022
- Premium Statistic Regularly consumed groceries in Australia 2022
Further related statistics
19
- Alcohol consumption frequency in the U.S. 2019, by age group
- Frequency of coffee and coffee drinks consumption in Norway 2017
- Frequency of Canadian out-of-home coffee consumption in British Columbia 2019
- Frequency of consuming non-alcoholic beers Philippines 2019, by age
- Frequency of consuming herbal or fruit tea bags Germany 2013-2017
- Frequency of consuming non-alcoholic beers Philippines 2019, by gender
- Frequency of online shopping in China 2018
- Frequency of consuming non-alcoholic beers Philippines 2019
- Consumption rate of products containing CBD oil U.S. 2022
- Frequency of specialty coffee consumption in the United States in 2001 and 2017
- Consumption rate of products containing CBD oil U.S. 2019, by gender
- Coffee drinking frequency in South Korea 2016
- Dumpling eating frequency South Korea 2021
- Frequency of eating savory bread spreads Germany 2013-2020
- Survey on the frequency of consumption of fishery products at home in Denmark 2016
- Reasons for drinking non-alcoholic beer in India 2019 by gender
- Instant noodle consumption frequency in South Korea 2017
- Frequency of eating ready meals in Flanders (Belgium) 2018
- Frequency of taking dietary supplements in Malaysia 2022
Further Content: You might find this interesting as well
Statistics
- Alcohol consumption frequency in the U.S. 2019, by age group
- Frequency of coffee and coffee drinks consumption in Norway 2017
- Frequency of Canadian out-of-home coffee consumption in British Columbia 2019
- Frequency of consuming non-alcoholic beers Philippines 2019, by age
- Frequency of consuming herbal or fruit tea bags Germany 2013-2017
- Frequency of consuming non-alcoholic beers Philippines 2019, by gender
- Frequency of online shopping in China 2018
- Frequency of consuming non-alcoholic beers Philippines 2019
- Consumption rate of products containing CBD oil U.S. 2022
- Frequency of specialty coffee consumption in the United States in 2001 and 2017
- Consumption rate of products containing CBD oil U.S. 2019, by gender
- Coffee drinking frequency in South Korea 2016
- Dumpling eating frequency South Korea 2021
- Frequency of eating savory bread spreads Germany 2013-2020
- Survey on the frequency of consumption of fishery products at home in Denmark 2016
- Reasons for drinking non-alcoholic beer in India 2019 by gender
- Instant noodle consumption frequency in South Korea 2017
- Frequency of eating ready meals in Flanders (Belgium) 2018
- Frequency of taking dietary supplements in Malaysia 2022
Roy Morgan. (July 15, 2019). Share of hot drinks consumed per week in Australia in 2019, by generation [Graph]. In Statista. Retrieved March 22, 2023, from https://www.statista.com/statistics/1027924/australia-hot-drink-consumption-by-generation/
Roy Morgan. "Share of hot drinks consumed per week in Australia in 2019, by generation." Chart. July 15, 2019. Statista. Accessed March 22, 2023. https://www.statista.com/statistics/1027924/australia-hot-drink-consumption-by-generation/
Roy Morgan. (2019). Share of hot drinks consumed per week in Australia in 2019, by generation. Statista. Statista Inc.. Accessed: March 22, 2023. https://www.statista.com/statistics/1027924/australia-hot-drink-consumption-by-generation/
Roy Morgan. "Share of Hot Drinks Consumed per Week in Australia in 2019, by Generation." Statista, Statista Inc., 15 Jul 2019, https://www.statista.com/statistics/1027924/australia-hot-drink-consumption-by-generation/
Roy Morgan, Share of hot drinks consumed per week in Australia in 2019, by generation Statista, https://www.statista.com/statistics/1027924/australia-hot-drink-consumption-by-generation/ (last visited March 22, 2023)
Share of hot drinks consumed per week in Australia in 2019, by generation [Graph], Roy Morgan, July 15, 2019. [Online]. Available: https://www.statista.com/statistics/1027924/australia-hot-drink-consumption-by-generation/