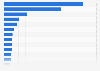
PPRO, 34 percent of the e-commerce purchases in Indonesia were paid for by card as of January 2020. According to the source, as of that time, e-commerce accounted for four percent of total retail in the country.
According to a report published byDistribution of payment methods for online transactions in Indonesia as of January 2020, by type
Basic Account
Get to know the platform
You only have access to basic statistics.
This statistic is not included in your account.
Starter Account
The ideal entry-level account for individual users
- Instant access to 1m statistics
- Download in XLS, PDF & PNG format
- Detailed references
$59 USD $39 USD / Month *
in the first 12 months
Professional Account
Full access
Business Solutions including all features.
* Prices do not include sales tax.
Statistics on Digital payment trends in the United Kingdom (UK)
Market share
6
- Premium Statistic Annual level of cash payments in the UK 2000-2021
- Premium Statistic Ratio of currency in circulation (CIC) to GDP of the UK 2012-2021
- Premium Statistic Most popular in-store payment methods in the UK 2017-2022
- Premium Statistic Payments at points of sale by type in the UK 2022
- Premium Statistic Most popular e-commerce payment methods in the UK 2016-2022
- Premium Statistic Most common online payments by type in the UK 2022
Penetration
7
- Premium Statistic Penetration rate of credit cards in the United Kingdom 2013-2028
- Premium Statistic Penetration rate of debit cards in the United Kingdom 2013-2028
- Premium Statistic Mobile payments by situation in the UK 2022
- Premium Statistic Payment types accepted by e-commerce vendors in United Kingdom between 2022 and 2024
- Premium Statistic Weekly consumer searches for "QR Code" topic on Google in the UK 2018-2023
- Premium Statistic Annual crypto adoption development in the UK 2020-2022, by metric
- Premium Statistic Instant payment share in payment transactions in the UK in 2021 and 2026
Biggest brands
5
- Premium Statistic Visa, Mastercard market share in the UK 2016-2021
- Premium Statistic Most used mobile payments by brand in the UK 2022
- Premium Statistic Most used online payments by brand in the UK 2022
- Premium Statistic Key buy now pay, later apps in the UK 2015-2023, based on quarterly downloads
- Premium Statistic Key crypto wallets in the UK 2015-2023, based on quarterly downloads
Users
7
- Premium Statistic Annual credit card and debit cards issued in the UK 2000-2021
- Premium Statistic Credit card penetration in the UK in 2011, 2014, 2017, and 2021, by demographic
- Premium Statistic Debit card penetration in the UK in 2011, 2014, 2017, and 2021, by demographic
- Premium Statistic Preference for payment by smartwatch in the UK in 2022, by age and gender
- Premium Statistic Buy now, pay later (BNPL) market size in the UK as of 2020
- Premium Statistic Quarterly number of crypto users in the UK 2021-2022
- Premium Statistic Crypto adoption in the UK as of November 2022, by age and gender
Transaction value
6
- Premium Statistic Annual credit card spending in the UK 2012-2021, in local currency and USD
- Premium Statistic Annual debit card spending in the UK 2012-2021, in local currency and USD
- Premium Statistic Annual contactless spending in the UK 2014-2022, in local currency and USD
- Premium Statistic Global QR payment market size in 2020 with forecasts to 2025, by region
- Premium Statistic Buy now, pay later (BNPL) market size in the UK in 2022, with a 2028 forecast
- Premium Statistic Annual instant payment spending in the UK 2008-2022, in local currency and USD
Number of transactions (per user)
6
- Premium Statistic Annual number of credit card transactions in the UK 2012-2021, per capita
- Premium Statistic Annual number of debit card transactions in the UK 2012-2021, per capita
- Premium Statistic Annual number of contactless card transactions in the UK 2014-2022
- Premium Statistic Annual number of instant payment transactions in the UK 2008-2022
- Premium Statistic Size of a credit card transaction in the UK 2012-2021, in local currency and USD
- Premium Statistic Size of a debit card transaction in the UK 2012-2021, in local currency and USD
Miscellaneous
7
- Premium Statistic POS terminals in the UK 2012-2021
- Premium Statistic Unbanked population in the UK in 2011, 2014, 2017, and 2021, by demographic
- Premium Statistic Internet users in the United Kingdom 2013-2028
- Premium Statistic Mobile internet usage reach in the United Kingdom 2013-2028
- Premium Statistic Online retail sales in the United Kingdom (UK) 2012-2022
- Premium Statistic Main cross-border online shopping markets in the UK 2021, by market share
- Premium Statistic Annual outgoing and incoming remittance flow in the UK 2021, by country
Further related statistics
7
- Distribution of online payment methods in Germany 2016
- Leading e-commerce payment methods in Malaysia 2021
- Most popular e-commerce payment methods in Turkey 2016-2021
- Event tickets: Online purchasing in Great Britain 2019, by demographic
- Consumer electronics: Online purchasing in Great Britain 2020, by demographic
- Survey on frequently used payment methods online in Sweden 2018
- Leading e-commerce payment methods in Poland 2016-2017
Further Content: You might find this interesting as well
Statistics
- Distribution of online payment methods in Germany 2016
- Leading e-commerce payment methods in Malaysia 2021
- Most popular e-commerce payment methods in Turkey 2016-2021
- Event tickets: Online purchasing in Great Britain 2019, by demographic
- Consumer electronics: Online purchasing in Great Britain 2020, by demographic
- Survey on frequently used payment methods online in Sweden 2018
- Leading e-commerce payment methods in Poland 2016-2017
PPRO. (March 24, 2020). Distribution of payment methods for online transactions in Indonesia as of January 2020, by type [Graph]. In Statista. Retrieved March 30, 2023, from https://www.statista.com/statistics/1176837/indonesia-share-of-online-payment-methods-by-type/
PPRO. "Distribution of payment methods for online transactions in Indonesia as of January 2020, by type." Chart. March 24, 2020. Statista. Accessed March 30, 2023. https://www.statista.com/statistics/1176837/indonesia-share-of-online-payment-methods-by-type/
PPRO. (2020). Distribution of payment methods for online transactions in Indonesia as of January 2020, by type. Statista. Statista Inc.. Accessed: March 30, 2023. https://www.statista.com/statistics/1176837/indonesia-share-of-online-payment-methods-by-type/
PPRO. "Distribution of Payment Methods for Online Transactions in Indonesia as of January 2020, by Type." Statista, Statista Inc., 24 Mar 2020, https://www.statista.com/statistics/1176837/indonesia-share-of-online-payment-methods-by-type/
PPRO, Distribution of payment methods for online transactions in Indonesia as of January 2020, by type Statista, https://www.statista.com/statistics/1176837/indonesia-share-of-online-payment-methods-by-type/ (last visited March 30, 2023)
Distribution of payment methods for online transactions in Indonesia as of January 2020, by type [Graph], PPRO, March 24, 2020. [Online]. Available: https://www.statista.com/statistics/1176837/indonesia-share-of-online-payment-methods-by-type/