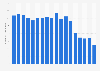
In 2020, the durable goods manufacturing industry sector contributed approximately 1.27 trillion U.S. dollars to U.S. economic growth. This figure compares to around 1.33 trillion U.S. dollars in 2019.
Value added of U.S. durable goods manufacturing between 2012 and 2020
(in billion U.S. dollars)
Profit from the additional features of your individual account
Currently, you are using a shared account. To use individual functions (e.g., mark statistics as favourites, set
statistic alerts) please log in with your personal account.
If you are an admin, please authenticate by logging in again.
Learn more about how Statista can support your business.
BEA. (September 30, 2021). Value added of U.S. durable goods manufacturing between 2012 and 2020 (in billion U.S. dollars) [Graph]. In Statista. Retrieved September 20, 2024, from https://www.statista.com/statistics/191956/value-added-by-us-durable-goods-manufacturing-since-2007/
BEA. "Value added of U.S. durable goods manufacturing between 2012 and 2020 (in billion U.S. dollars)." Chart. September 30, 2021. Statista. Accessed September 20, 2024. https://www.statista.com/statistics/191956/value-added-by-us-durable-goods-manufacturing-since-2007/
BEA. (2021). Value added of U.S. durable goods manufacturing between 2012 and 2020 (in billion U.S. dollars). Statista. Statista Inc.. Accessed: September 20, 2024. https://www.statista.com/statistics/191956/value-added-by-us-durable-goods-manufacturing-since-2007/
BEA. "Value Added of U.S. Durable Goods Manufacturing between 2012 and 2020 (in Billion U.S. Dollars)." Statista, Statista Inc., 30 Sep 2021, https://www.statista.com/statistics/191956/value-added-by-us-durable-goods-manufacturing-since-2007/
BEA, Value added of U.S. durable goods manufacturing between 2012 and 2020 (in billion U.S. dollars) Statista, https://www.statista.com/statistics/191956/value-added-by-us-durable-goods-manufacturing-since-2007/ (last visited September 20, 2024)
Value added of U.S. durable goods manufacturing between 2012 and 2020 (in billion U.S. dollars) [Graph], BEA, September 30, 2021. [Online]. Available: https://www.statista.com/statistics/191956/value-added-by-us-durable-goods-manufacturing-since-2007/