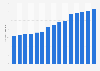
In 2022, U.S. national park visitors spent an average of over 516 U.S. dollars per day on lodges within the parks themselves. Meanwhile, lodges outside the parks amounted to roughly 391 U.S. dollars per person per day.
Average visitor spending per day/night at national parks in the United States from 2010 to 2022, by category
(in U.S. dollars)
Profit from the additional features of your individual account
Currently, you are using a shared account. To use individual functions (e.g., mark statistics as favourites, set
statistic alerts) please log in with your personal account.
If you are an admin, please authenticate by logging in again.
Learn more about how Statista can support your business.
National Park Service. (August 12, 2023). Average visitor spending per day/night at national parks in the United States from 2010 to 2022, by category (in U.S. dollars) [Graph]. In Statista. Retrieved September 19, 2024, from https://www.statista.com/statistics/220975/average-spending-in-regions-around-us-national-parks/
National Park Service. "Average visitor spending per day/night at national parks in the United States from 2010 to 2022, by category (in U.S. dollars)." Chart. August 12, 2023. Statista. Accessed September 19, 2024. https://www.statista.com/statistics/220975/average-spending-in-regions-around-us-national-parks/
National Park Service. (2023). Average visitor spending per day/night at national parks in the United States from 2010 to 2022, by category (in U.S. dollars). Statista. Statista Inc.. Accessed: September 19, 2024. https://www.statista.com/statistics/220975/average-spending-in-regions-around-us-national-parks/
National Park Service. "Average Visitor Spending per Day/Night at National Parks in The United States from 2010 to 2022, by Category (in U.S. Dollars)." Statista, Statista Inc., 12 Aug 2023, https://www.statista.com/statistics/220975/average-spending-in-regions-around-us-national-parks/
National Park Service, Average visitor spending per day/night at national parks in the United States from 2010 to 2022, by category (in U.S. dollars) Statista, https://www.statista.com/statistics/220975/average-spending-in-regions-around-us-national-parks/ (last visited September 19, 2024)
Average visitor spending per day/night at national parks in the United States from 2010 to 2022, by category (in U.S. dollars) [Graph], National Park Service, August 12, 2023. [Online]. Available: https://www.statista.com/statistics/220975/average-spending-in-regions-around-us-national-parks/