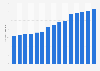
- Sports & Recreation›
- Parks & Outdoors›
Distribution of national park visitor spending in the U.S. 2017, by category
Distribution of national park visitor spending in the United States in 2017, by category

Share of visitor spending | |
---|---|
Hotels, motels and B&Bs | 30.39% |
Restaurants & bars | 20.44% |
Gas & oil | 12.15% |
Admission & fees | 9.94% |
Souvenirs & other expenses | 9.94% |
Local transportation | 7.73% |
Groceries & takeout food | 7.18% |
Camping fees | 2.21% |
Share of visitor spending | |
---|---|
Hotels, motels and B&Bs | 30.39% |
Restaurants & bars | 20.44% |
Gas & oil | 12.15% |
Admission & fees | 9.94% |
Souvenirs & other expenses | 9.94% |
Local transportation | 7.73% |
Groceries & takeout food | 7.18% |
Camping fees | 2.21% |
© Statista 2019
About this statistic
Show source
Please be patient - this may take a moment
Description
Source
More information
- Show sources information
- Show publisher information
- Release date
- April 2018
- Region
- United States
- Survey time period
- 2017
- Supplementary notes
- In 2017, National Park visitors spent a total of 18.2 billion U.S. dollars.
- Region
- United States
- Survey time period
- 2017
- Supplementary notes
- In 2017, National Park visitors spent a total of 18.2 billion U.S. dollars.


You only have access to basic statistics.
- Instant access to 1m statistics
- Download in XLS, PDF & PNG format
- Detailed references
$49 / Month *
Corporate solution including all features.
Prices do not include sales tax.


All Information
in one Presentation
- 58 page/s
- English
- pptx
- Detailed references
Everything On "National park tourism in the U.S." in One Document: Edited and Divided into Handy Chapters. Including Detailed References.
Statista has been my savior on several occasions. The site is easy to maneuver and the data is in a format that can go right into a report or presentation.Marlene Greenfield
Vice President, Hearst Magazines
- Overview
- Number of recreational visitors to National Park Service sites from 2008 to 2017 (in millions)Number of visitors to National Park Service sites 2008-2017
- Number of visitors to national parks and sites in the United States from 2010 to 2017, by type of park (in millions)Number of visitors to national parks and sites in the U.S. 2010-2017, by type
- Average number of visitors per day to National Parks, monuments and sites from 2010 to 2017, by month (in thousands)Visitors per day to National Park Service sites by month 2010-2017
- Distribution of recreational visits to national parks and sites by type of site in 2017Distribution of visits to national parks by type of park 2017
- Visitation figures
- Most visited units of the national park system in the United States in 2017 (in millions)Most visited units of the national park system in the U.S. 2017
- Number of recreational visitors to Golden Gate National Recreational Area in the United States from 2008 to 2018 (in millions)Number of visitors to Golden Gate National Recreational Area in the U.S. 2008-2018
- Number of recreational visitors to the Great Smoky Mountains National Park in the United States from 2008 to 2018 (in millions)Number of visitors to the Great Smoky Mountains National Park in the U.S. 2008-2018
- Number of recreational visitors to the Gateway National Recreation Area in the United States from 2008 to 2018 (in millions)Number of visitors to the Gateway National Recreation Area in the U.S. 2008-2018
- Number of recreational visitors to the George Washington Memorial Parkway in the United States from 2008 to 2018 (in millions)Number of visitors to the George Washington Memorial Parkway in the U.S. 2008-2018
- Number of recreational visitors to Natchez Trace Parkway in the United States from 2008 to 2017 (in millions)Number of visitors to Natchez Trace Parkway in the U.S. 2008-2017
- Number of recreational visitors to the Grand Canyon National Park in the United States from 2008 to 2018 (in millions)Number of visitors to the Grand Canyon National Park in the U.S. 2008-2018
- Number of recreational visitors to the Vietnam Veterans Memorial in the United States from 2008 to 2017 (in millions)Number of visitors to the Vietnam Veterans Memorial in the U.S. 2008-2017
- Visitor spending
- Direct economic contribution of national park visitor spending in the United States from 2012 to 2017 (in billion U.S. dollars)Economic contribution of national park visitor spending in the U.S. 2012-2017
- Distribution of national park visitor spending in the United States in 2017, by categoryDistribution of national park visitor spending in the U.S. 2017, by category
- National park visitor spending in the United States from 2012 to 2017, by segment (in billion U.S. dollars)National park visitor spending in the U.S. 2012-2017, by segment
- Average national park visitor spending per party per day/night in the United States from 2010 to 2017, by segment (in U.S. dollars)National park visitor spending per party per day in the U.S. 2010-2017, by segment
- Outdoor recreation
- Most popular camping destination types in North America in 2017Most popular camping destination types in North America 2017
- Destinations campers from the United States intend to visit in 2017Intended camping destinations for U.S. campers in 2017
- What motivates you to participate in outdoor activities?Motivational factors for outdoor activity participation in the U.S. in 2017
- Most popular outdoor activities in the United States from 2009 to 2017, by number of participants (in millions)Most popular outdoor activities in the U.S. from 2009 to 2017
- Number of participants in camping in the United States from 2006 to 2017 (in millions)*Participants in camping in the U.S. from 2006 to 2017
- Number of participants in hiking in the United States from 2006 to 2017 (in millions)Number of participants in hiking in the U.S. 2006-2017
- Italy: distribution of foreign tourists' expenditure by accommodation in Tuscany 2016
- Per capita expenditure of domestic and international summer travelers in Norway 2016
- Expenditure of domestic and international winter travelers in Norway 2016
- Expenditure of domestic winter travelers in Norway 2016, by segment
- Expenditure of summer tourists in Norway 2016, by nationality
- Per capita expenditure of domestic and international winter travelers in Norway 2016
- Expenditure of domestic and international summer travelers in Norway 2016
- Expenditure of domestic summer travelers in Norway 2016, by segment
- Daily expenditure of domestic and international winter travelers in Norway 2016
- Daily expenditure of domestic and international summer travelers in Norway 2016
- Daily expenditure of summer business travelers in Norway 2016, by segment
- Daily expenditure of summer tourists in Norway 2016, by segment
- Daily expenditure of summer tourists in Norway 2016, by nationality
- Expenditure of international summer travelers in Norway 2016, by segment
- Expenditure of international winter travelers in Norway 2016, by segment
- Chile: tourist spending per capita 2017
- Number of visitors to Grasslands National Park in Canada 2011-2018
- Number of prefectural natural parks in Japan 2010-2017
- Number of visitors to Cartier Brébeuf historic site in Canada 2011-2018
- Number of visitors to St. Peters Canal historic site in Canada 2011-2013
- Number of visitors to national parks and sites in the United States from 2010 to 2017, by type of park (in millions)
- Distribution of recreational visits to national parks and sites by type of site in 2017
- Number of recreational visitors to Golden Gate National Recreational Area in the United States from 2008 to 2018 (in millions)
- Number of recreational visitors to the Great Smoky Mountains National Park in the United States from 2008 to 2018 (in millions)
- Number of recreational visitors to the Gateway National Recreation Area in the United States from 2008 to 2018 (in millions)
- Number of recreational visitors to the George Washington Memorial Parkway in the United States from 2008 to 2018 (in millions)
- Number of recreational visitors to Natchez Trace Parkway in the United States from 2008 to 2017 (in millions)
- Number of recreational visitors to the Grand Canyon National Park in the United States from 2008 to 2018 (in millions)
- Number of recreational visitors to the Vietnam Veterans Memorial in the United States from 2008 to 2017 (in millions)
- Number of recreational visitors to Yosemite National Park in the United States from 2008 to 2017 (in millions)
- Number of recreational visitors to Yellowstone National Park in the United States from 2008 to 2017 (in millions)
- Distribution of national park visitor spending in the United States in 2017, by category
- What motivates you to participate in outdoor activities?
- Most popular outdoor activities in the United States from 2009 to 2017, by number of participants (in millions)
- Number of participants in camping in the United States from 2006 to 2017 (in millions)*
- Number of participants in hiking in the United States from 2006 to 2017 (in millions)
- Number of prefectural natural parks in Japan from 2010 to 2017
- Number of recreational visitors to National Park Service sites from 2008 to 2017 (in millions)
- Average number of visitors per day to National Parks, monuments and sites from 2010 to 2017, by month (in thousands)
- Most visited units of the national park system in the United States in 2017 (in millions)
- Direct economic contribution of national park visitor spending in the United States from 2012 to 2017 (in billion U.S. dollars)
- National park visitor spending in the United States from 2012 to 2017, by segment (in billion U.S. dollars)
- Average national park visitor spending per party per day/night in the United States from 2010 to 2017, by segment (in U.S. dollars)
- Most popular camping destination types in North America in 2017
- Destinations campers from the United States intend to visit in 2017
- Distribution of foreign tourists' accommodation expenditure in Tuscany in 2016, by type
- Per capita expenditure of domestic and international travelers in Norway in summer 2016 (in NOK)
- Expenditure of domestic and international travelers in Norway in winter 2016 (in billion NOK)
- Expenditure of domestic travelers in Norway in winter 2016, by segment (in million NOK)
- Expenditure of tourists in Norway in summer 2016, by nationality (in million NOK)
- Per capita expenditure of domestic and international travelers in Norway in winter 2016 (in NOK)
- Expenditure of domestic and international travelers in Norway in summer 2016 (in billion NOK)
- Expenditure of domestic travelers in Norway in summer 2016, by segment (in million NOK)
- Daily expenditure of domestic and international travelers in Norway in winter 2016 (in NOK per capita)
- Daily expenditure of domestic and international travelers in Norway in summer 2016 (in NOK per capita)
- Daily expenditure of domestic and international business travelers in Norway in summer 2016, by segment (in NOK per capita)
- Daily expenditure of domestic and international tourists in Norway in summer 2016, by segment (in NOK per capita)
- Daily expenditure of summer tourists in Norway 2016, by nationality (in NOK per capita)
- Expenditure of international travelers in Norway in summer 2016, by segment (in million NOK)
- Expenditure of international travelers in Norway in winter 2016, by segment (in million NOK)
- International tourist spending per capita in Chile in 2017, by quarter (in U.S. dollars)
- Number of visitors to Grasslands National Park in Canada from 2011 to 2018 (in thousands)
- Number of visitors to Cartier Brébeuf national historic site in Canada from 2011 to 2018 (in thousands)
- Number of visitors to St. Peters Canal national historic site in Canada from 2011 to 2013 (in 1,000s)
Statista offers dossiers and reports on over 170 industries. With Statista you are always able to make informed decisions and boost your work efficiency.
Internet & Telecommunications
- Social Media
- E-Commerce
- Online Video & Entertainment
- Advertising & Marketing
Consumer Goods & FMCG
- Alcoholic Beverages
- Cleaning Products
- Cosmetics & Personal Care
- Food & Nutrition
Retail & Trade
- Health & Hygiene
- International Trade
- Shopping Behavior
- Sports & Leisure
Travel, Tourism & Hospitality
- Business Travel
- Leisure Travel
- Accomodation
- Restaurants
Society
- Demographics
- Economy
- Education & Science
- Politics & Government
Transportation & Logistics
- Aviation
- Rail Transport
- Vehicles & Road Traffic
- Water Transport
Register in seconds and access exclusive features.
Basic Account |
Instant Access
Premium Account | ||
---|---|---|---|
Our servicesClick the question mark for further information | Free |
$49 per month* | |
Basic statistics | |||
Premium statistics | |||
Graph download
| |||
Download PDF | |||
Excel download
| |||
Register | Purchase now |
This feature is limited to our corporate solutions.
Please contact us to get started with full access to dossiers, forecasts, studies and international data.

The Italian pharmaceutical market is among the fastest growing ones worldwide. This dossier provides data on the trends of the market, with special focus on pharmaceutical segments.

To our 150 Reports we added:
- Global Consumer Survey content
- Operational risk index by Fitch
- And more …

The global plastics industry is growing by approximately three percent every year. This dossier provides information about the global plastics industry in general as well as chapters on the major types of plastic, and recycling rates.

Updates on eCommerce, Digital Media, eTravel, eServices and more
- Market figures for 2018 to 2023
- Company and startup profiles
- User demographics

U.S. coal production has steadily declined in the past decade, but has been in the news in recent years due to President Trump's desire to revitalize the industry. This document provides an overview of the key figures, leading companies, and the employment trends in the U.S. coal mining industry.

This new export feature offers
- Structured graphical representation of the data
- Tailored target group analysis
- Option for further processing

The Polish e-commerce market is one of the fastest developing e-commerce markets in Europe. The latest data for Poland is presented in this dossier.

Plastic waste is an issue of global concern. Since China banned the import of recycled plastic, the U.S. has had to make adjustments to its management of plastic waste. This dossier provides an overview of plastic waste in the U.S.

This dossier provides an overview of hedge funds worldwide. Global hedge fund assets, performance, investors, and other topics are highlighted.

The Outdoor Advertising Association of America covers amongst others
- Number of billboards
- Outdoor advertising revenue
- Number of out-of-home displays

Find data, perceptions & more about
- Economic consequences
- Impact on the labor market
- A second referendum

Understand the recent developments in the Spanish eCommerce market!
- URL-related revenues
- Relevant online store KPIs
- eCommerce-related contacts

- Extended statistical dossier
- Insights, explanations & interpretations
- Challenges of the digital future

eCommerce is rapidly becoming a part of the Latin American shopping culture. The dossier includes data on
- Regional online shopping events
- Events by country

The outline of potential impacts of Brexit on UK industries has been updated in the UK Industry Reports.

Italian enterprises invest significantly in digital marketing. Find out about
- Relevant aspects & KPIs
- New trends
- Different strategies

Statista European Football Benchmark
- The big 5 European leagues
- All about the clubs & fans
- Sponsors & how they fit in
We use cookies to personalize contents and ads, offer social media features, and analyze access to our website. In your browser settings you can configure or disable this, respectively, and can delete any already placed cookies. For details, please see your browser’s Help section (by pressing F1). Please see our privacy statement for details about how we use data.