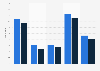
The timeline presents data on Time Warner Cable's pay TV market share from 2008 to 2015, as well as a forecast until 2022. According to the presented estimate, the share amounted to 12.9 in 2008 and Trefis projected it would fall to 10.3 percent in 2022.
Time Warner Cable's pay TV market share in the United States from 2008 to 2022
Profit from the additional features of your individual account
Currently, you are using a shared account. To use individual functions (e.g., mark statistics as favourites, set
statistic alerts) please log in with your personal account.
If you are an admin, please authenticate by logging in again.
Learn more about how Statista can support your business.
Trefis.com. (June 8, 2016). Time Warner Cable's pay TV market share in the United States from 2008 to 2022 [Graph]. In Statista. Retrieved September 19, 2024, from https://www.statista.com/statistics/251361/time-warner-cable-pay-tv-market-share/
Trefis.com. "Time Warner Cable's pay TV market share in the United States from 2008 to 2022." Chart. June 8, 2016. Statista. Accessed September 19, 2024. https://www.statista.com/statistics/251361/time-warner-cable-pay-tv-market-share/
Trefis.com. (2016). Time Warner Cable's pay TV market share in the United States from 2008 to 2022. Statista. Statista Inc.. Accessed: September 19, 2024. https://www.statista.com/statistics/251361/time-warner-cable-pay-tv-market-share/
Trefis.com. "Time Warner Cable's Pay Tv Market Share in The United States from 2008 to 2022." Statista, Statista Inc., 8 Jun 2016, https://www.statista.com/statistics/251361/time-warner-cable-pay-tv-market-share/
Trefis.com, Time Warner Cable's pay TV market share in the United States from 2008 to 2022 Statista, https://www.statista.com/statistics/251361/time-warner-cable-pay-tv-market-share/ (last visited September 19, 2024)
Time Warner Cable's pay TV market share in the United States from 2008 to 2022 [Graph], Trefis.com, June 8, 2016. [Online]. Available: https://www.statista.com/statistics/251361/time-warner-cable-pay-tv-market-share/