In 2021, an estimated 1.72 million people used Puma sports shoes and trainers. This was an increase of over 65 thousand users compared to 2020. Ranked second and third were Puma's sports clothing and accessories.
Puma products ranked by number of consumers in Great Britain from 2013 to 2021 , by clothing product category (in 1,000s)
Basic Account
Get to know the platform
You only have access to basic statistics.
This statistic is not included in your account.
Starter Account
The ideal entry-level account for individual users
- Instant access to 1m statistics
- Download in XLS, PDF & PNG format
- Detailed references
$149 USD / Month *
Professional Account
Full access
Business Solutions including all features.
* Prices do not include sales tax.
Other statistics that may interest you Sports clothing and equipment consumption in Great Britain (Kantar Media TGI)
Sports equipment expenditure
3
Sportswear brand rankings
3
Sportswear brand products
8
- Premium Statistic Leading Adidas products in Great Britain 2013-2021, by number of users
- Premium Statistic Nike products purchased in Great Britain 2013-2021, by clothing product type
- Premium Statistic Slazenger products purchased in Great Britain 2014-2021, by clothing product type
- Premium Statistic Reebok products purchased in Great Britain 2013-2021, by clothing product type
- Premium Statistic 
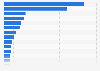
Puma products purchased in Great Britain 2013-2021 by clothing product type
- Premium Statistic Umbro products purchased in Great Britain 2013-2021, by clothing product type
- Premium Statistic Bench products purchased in Great Britain 2013-2021, by category
- Premium Statistic Fred Perry products purchased in Great Britain 2013-2021, by clothing product type
Further related statistics
16
- Lonsdale clothing products in Great Britain 2014-2020, by user numbers
- Merrell products purchased in Great Britain 2014-2020, by clothing product type
- Onitsuka Tiger products purchased in the UK 2014-2016, by clothing product type
- For whom consumers purchase sports apparel, shoes and/or equipment in the U.S. 2018
- Occasions when consumers wear sportswear and sports shoes in the U.S. 2018
- Frequency of purchasing sports apparel, shoes and/or equipment in the U.S. 2016
- LatAm: per capita spending on sports footwear in 2016, by country
- Chile: sportswear market key figures in 2021
- Number of FGL Sports stores in Canada by brand 2017
- Canada's number of FGL Sports stores 2016-2018
- Canadian square footage revenue of FGL Sports 2016-2018
- Important qualities for consumers when buying sports apparel, shoes, equipment 2018
- Value of sports footwear imports to Canada by country of origin 2022
- Sales share of Feng Tay Taiwan 2016. by region
- Low price influence on sports footwear purchase decisions in the United States 2014
- Industry revenue of “manufacture of wearing apparel“ in the Philippines 2012-2024
Further Content: You might find this interesting as well
Statistics
- Lonsdale clothing products in Great Britain 2014-2020, by user numbers
- Merrell products purchased in Great Britain 2014-2020, by clothing product type
- Onitsuka Tiger products purchased in the UK 2014-2016, by clothing product type
- For whom consumers purchase sports apparel, shoes and/or equipment in the U.S. 2018
- Occasions when consumers wear sportswear and sports shoes in the U.S. 2018
- Frequency of purchasing sports apparel, shoes and/or equipment in the U.S. 2016
- LatAm: per capita spending on sports footwear in 2016, by country
- Chile: sportswear market key figures in 2021
- Number of FGL Sports stores in Canada by brand 2017
- Canada's number of FGL Sports stores 2016-2018
- Canadian square footage revenue of FGL Sports 2016-2018
- Important qualities for consumers when buying sports apparel, shoes, equipment 2018
- Value of sports footwear imports to Canada by country of origin 2022
- Sales share of Feng Tay Taiwan 2016. by region
- Low price influence on sports footwear purchase decisions in the United States 2014
- Industry revenue of “manufacture of wearing apparel“ in the Philippines 2012-2024
Kantar. (July 14, 2022). Puma products ranked by number of consumers in Great Britain from 2013 to 2021 , by clothing product category (in 1,000s) [Graph]. In Statista. Retrieved December 08, 2023, from https://www.statista.com/statistics/312848/puma-leading-products-in-the-uk/
Kantar. "Puma products ranked by number of consumers in Great Britain from 2013 to 2021 , by clothing product category (in 1,000s)." Chart. July 14, 2022. Statista. Accessed December 08, 2023. https://www.statista.com/statistics/312848/puma-leading-products-in-the-uk/
Kantar. (2022). Puma products ranked by number of consumers in Great Britain from 2013 to 2021 , by clothing product category (in 1,000s). Statista. Statista Inc.. Accessed: December 08, 2023. https://www.statista.com/statistics/312848/puma-leading-products-in-the-uk/
Kantar. "Puma Products Ranked by Number of Consumers in Great Britain from 2013 to 2021 , by Clothing Product Category (in 1,000s)." Statista, Statista Inc., 14 Jul 2022, https://www.statista.com/statistics/312848/puma-leading-products-in-the-uk/
Kantar, Puma products ranked by number of consumers in Great Britain from 2013 to 2021 , by clothing product category (in 1,000s) Statista, https://www.statista.com/statistics/312848/puma-leading-products-in-the-uk/ (last visited December 08, 2023)
Puma products ranked by number of consumers in Great Britain from 2013 to 2021 , by clothing product category (in 1,000s) [Graph], Kantar, July 14, 2022. [Online]. Available: https://www.statista.com/statistics/312848/puma-leading-products-in-the-uk/