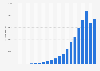
As of March 2022, 30.8 percent of Twitter employees were of Asian ethnicity. Overall, 8.4 percent of Twitter employees were of Latinx ethnicity. Additionally, the majority of employees were white. There were a total of 7,500 Twitter employees at the end of 2021.
Distribution of Twitter employees in the United States in 2022, by ethnicity
Includes regular, full-time employees who were active or on leave as of the effective date
Supplementary notes
This section is based on employee self-identification. Percentages may not sum to 100 due to rounding and that some Tweeps Decline to Disclose.
“Indigenous” includes Native American, Native Alaskan, and Native Hawaiian/Pacific Islander populations.
Profit from the additional features of your individual account
Currently, you are using a shared account. To use individual functions (e.g., mark statistics as favourites, set
statistic alerts) please log in with your personal account.
If you are an admin, please authenticate by logging in again.
Learn more about how Statista can support your business.
Twitter. (March 31, 2022). Distribution of Twitter employees in the United States in 2022, by ethnicity [Graph]. In Statista. Retrieved September 19, 2024, from https://www.statista.com/statistics/313585/twitter-employee-ethnicity-us/
Twitter. "Distribution of Twitter employees in the United States in 2022, by ethnicity." Chart. March 31, 2022. Statista. Accessed September 19, 2024. https://www.statista.com/statistics/313585/twitter-employee-ethnicity-us/
Twitter. (2022). Distribution of Twitter employees in the United States in 2022, by ethnicity. Statista. Statista Inc.. Accessed: September 19, 2024. https://www.statista.com/statistics/313585/twitter-employee-ethnicity-us/
Twitter. "Distribution of Twitter Employees in The United States in 2022, by Ethnicity." Statista, Statista Inc., 31 Mar 2022, https://www.statista.com/statistics/313585/twitter-employee-ethnicity-us/
Twitter, Distribution of Twitter employees in the United States in 2022, by ethnicity Statista, https://www.statista.com/statistics/313585/twitter-employee-ethnicity-us/ (last visited September 19, 2024)
Distribution of Twitter employees in the United States in 2022, by ethnicity [Graph], Twitter, March 31, 2022. [Online]. Available: https://www.statista.com/statistics/313585/twitter-employee-ethnicity-us/