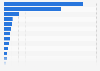
This statistic depicts the government revenue in Hong Kong from financial years 2008 to 2020. In the financial year 2019-2020, the government revenue in Hong Kong came to around 491 billion Hong Kong dollars.
Government revenue in Hong Kong from FY 2008 to FY 2020 (in billion Hong Kong dollars)*
Basic Account
Get to know the platform
You only have access to basic statistics.
This statistic is not included in your account.
Single Account
The ideal entry-level account for individual users
- Instant access to 1m statistics
- Download in XLS, PDF & PNG format
- Detailed references
$59 $39 / Month *
in the first 12 months
Corporate Account
Full access
Corporate solution including all features.
* Prices do not include sales tax.
Further Content: You might find this interesting as well
Statistics
- United Kingdom (UK): Monthly public sector current budget deficit 2017 to 2019
- Government's capital expenditure of Macao 2019, by type
- United Kingdom (UK): Monthly public sector current budget deficit 2014 to 2019
- United Kingdom (UK): Public sector current budget deficit 2004-2019
- Domestic loans to private sector in Macao 2009-2019
- Government debt in the United Kingdom as a share of GDP 1994-2019
- UK national debt: monthly public sector net borrowing (PSNB) 2014 to 2018
- United Kingdom (UK): Public sector net investment (ex) 2004-2018
- United Kingdom monthly public sector net investment (excluding banks) 2014 to 2018
- Canadian's priorities for government funding in water infrastructure by region 2016
- Canadian's priorities for government funding in water infrastructure 2016
- Canadian's priorities for government funding by region 2017
- United Kingdom (UK): Monthly public sector net investment 2015 to 2019
- Canadian's priorities for government funding 2017
- Public sector net borrowing in the United Kingdom 2000-2019
- Individuals employed in governmental occupations in the UK in 2018, by employment
- Share of governmental staff with internal e-mail access Hong Kong 2009-2019
- Young Hungarians' satisfaction with the government 2020
- Operating expenses of the general government New Zealand 2018 by type
- Share of governmental staff with designated workstations Hong Kong 2009-2019
Census and Statistics Department Hong Kong. (June 15, 2020). Government revenue in Hong Kong from FY 2008 to FY 2020 (in billion Hong Kong dollars)* [Graph]. In Statista. Retrieved March 04, 2021, from https://www.statista.com/statistics/317129/hong-kong-government-revenue/
Census and Statistics Department Hong Kong. "Government revenue in Hong Kong from FY 2008 to FY 2020 (in billion Hong Kong dollars)*." Chart. June 15, 2020. Statista. Accessed March 04, 2021. https://www.statista.com/statistics/317129/hong-kong-government-revenue/
Census and Statistics Department Hong Kong. (2020). Government revenue in Hong Kong from FY 2008 to FY 2020 (in billion Hong Kong dollars)*. Statista. Statista Inc.. Accessed: March 04, 2021. https://www.statista.com/statistics/317129/hong-kong-government-revenue/
Census and Statistics Department Hong Kong. "Government Revenue in Hong Kong from Fy 2008 to Fy 2020 (in Billion Hong Kong Dollars)*." Statista, Statista Inc., 15 Jun 2020, https://www.statista.com/statistics/317129/hong-kong-government-revenue/
Census and Statistics Department Hong Kong, Government revenue in Hong Kong from FY 2008 to FY 2020 (in billion Hong Kong dollars)* Statista, https://www.statista.com/statistics/317129/hong-kong-government-revenue/ (last visited March 04, 2021)