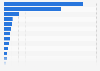
- Retail & Trade›
- International Trade›
Value of domestic exports from Hong Kong 2017, by destination
Industry-specific and extensively researched technical data (partially from exclusive partnerships).
A paid subscription is required for full access.
Value of domestic exports from Hong Kong in 2017, by destination (in billion Hong Kong dollars)
Exclusive Premium Statistic

Exports in billion HKD | |
---|---|
- | - |
- | - |
- | - |
- | - |
- | - |
- | - |
- | - |
- | - |
- | - |
- | - |
- | - |
Exports in billion HKD | |
---|---|
- | - |
- | - |
- | - |
- | - |
- | - |
- | - |
- | - |
- | - |
- | - |
- | - |
- | - |
You need a Premium Account for unlimited access.
Full access to 1.5m statistics
Incl. source references
Available to download in PNG, PDF, XLS format
You need a Premium Account for unlimited access.
Full access to 1.5m statistics
Incl. source references
Available to download in PNG, PDF, XLS format
© Statista 2019
About this statistic
Show source
Please be patient - this may take a moment
Description
Source
More information
- Show sources information
- Show publisher information
- Release date
- February 2018
- Region
- Hong Kong
- Survey time period
- 2017
- Supplementary notes
- Note: 1 Hong Kong dollar equals about 0.13 U.S. dollars and 0.11 euros (as of January 2019).
- Region
- Hong Kong
- Survey time period
- 2017
- Supplementary notes
- Note: 1 Hong Kong dollar equals about 0.13 U.S. dollars and 0.11 euros (as of January 2019).


You only have access to basic statistics.
This statistic is not included in your account!
- Instant access to 1m statistics
- Download in XLS, PDF & PNG format
- Detailed references
$49 / Month *
Corporate solution including all features.
Prices do not include sales tax.


All Information
in one Presentation
- 87 page/s
- English
- pptx
- Detailed references
Everything On "Hong Kong" in One Document: Edited and Divided into Handy Chapters. Including Detailed References.
I think of Statista as Google for researchers. Statista provides you with the information you search for right away.Dr. Horst Stipp
EVP, Research & Innovation, Advertising Research Foundation
- Population
- Population of Hong Kong from 2009 to 2017 (in millions)Population of Hong Kong 2017
- Breakdown of population aged 15 and above in Hong Kong from 2008 to 2017, by genderBreakdown of population aged 15 and above in Hong Kong 2008-2017, by gender
- Crude birth rate in Hong Kong from 2008 to 2017 (per 1,000 people)Crude birth rate in Hong Kong 2008-2017
- Life expectancy at birth in Hong Kong from 2008 to 2017, by genderLife expectancy at birth in Hong Kong 2017, by gender
- Breakdown of population in Hong Kong as of August 2018, by language Breakdown of population in Hong Kong as of August 2018, by language
- Infrastructure
- Land area of Hong Kong in 2017, by region (in square kilometers)Land area of Hong Kong 2017 by region
- Water consumption in Hong Kong from 2008 to 2017 (in million cubic meters)Water consumption in Hong Kong 2017
- Electricity consumption in Hong Kong from 2008 to 2017, by use (in GWh)Electricity consumption in Hong Kong 2017, by use
- Hospital bed density in Hong Kong from 2008 to 2017 (in hospital beds per 1,000 inhabitants)Hospital bed density in Hong Kong 2008-2017
- Economy
- Gross domestic product (GDP) in Hong Kong from 2006 to 2017 (in billion Hong Kong dollars)*Gross domestic product of Hong Kong 2006-2017
- Gross domestic product at current market prices of Hong Kong from 2007 to 2016, by sector (in billion Hong Kong dollars)Gross domestic product of Hong Kong 2016, by sector
- Gross domestic product of the service industry in Hong Kong in 2016, by sector (in billion Hong Kong dollars)Gross domestic product of the service industry in Hong Kong 2016, by sector
- Consumer price index* (CPI) in Hong Kong from 2008 to 2017Consumer price index in Hong Kong 2008-2017
- Forecast of retail sales growth in Hong Kong from 2008 to 2018, by volumeForecast of retail sales growth in Hong Kong 2008-2018
- Foreign trade
- Value of imports into Hong Kong in 2017, by region of origin (in billion Hong Kong dollars)Value of imports into Hong Kong 2017, by region of origin
- Value of domestic exports from Hong Kong in 2017, by destination (in billion Hong Kong dollars)Value of domestic exports from Hong Kong 2017, by destination
- Hong Kong trade balance of services from 2009 to 2015 (in billion Hong Kong dollars)Hong Kong trade balance of services 2009-2015
- Merchandise trade balance of Taiwan with mainland China and Hong Kong from 2008 to 2017 (in billion U.S. dollars)Merchandise trade balance of Taiwan with China and Hong Kong 2008-2017
- Volume of U.S. exports of trade goods to Hong Kong from 1985 to 2017 (in billion U.S. dollars)Hong Kong - U.S. exports 1985-2017
- Employment and earnings
- Number of labor force in Hong Kong from 2008 to 2017, by gender (in 1,000 people)Number of labor force in Hong Kong 2008-2017, by gender
- Number of employed people in Hong Kong in 2017, by monthly earningsNumber of employed people in Hong Kong 2017 by monthly earnings
- Unemployment rate in Hong Kong from 2008 to 2017Unemployment rate in Hong Kong 2008-2017
- Top ten wealthiest people in Hong Kong, China as of January 2018 (in billion U.S. dollars)Top ten wealthiest people in Hong Kong, China as of January 2018
- Government
- Government revenue in Hong Kong from 2008 to 2018 (in billion Hong Kong dollars)*Total revenue of the Hong Kong government 2008-2018*
- Government expenditure in Hong Kong from 2008 to 2018 (in billion Hong Kong dollars)*Total expenditure of the Hong Kong government 2008-2018
- Government reserve balances of Hong Kong from 2008 to 2017 (in billion Hong Kong dollars)Government reserve balances of Hong Kong 2008-2017
- Digital usage
- Internet penetration in Asia as of June 2018, by countryAsia Pacific: internet penetration 2018, by country
- Countries with the highest average internet connection speed as of 1st quarter 2017 (in Mbps)Countries with the fastest average internet connection speed 2017
- Countries with the largest rate of high broadband connectivity as of 1st quarter 2017Countries with largest 10 Mbps broadband connectivity 2017
- Number of internet users in the Asia Pacific region as of January 2018, by country (in millions)Asia Pacific: number of internet users in selected countries 2018
- Number of mobile internet users in Hong Kong from 2017 to 2023 (in millions)Mobile phone internet users in Hong Kong 2017-2023
- Number of monthly active social media users in Asia Pacific as of January 2018, by country (in millions)Monthly active social media users in APAC countries 2018
- Social network user penetration in Hong Kong from 2017 to 2023Social media user penetration in Hong Kong 2017-2023
- Number of Facebook users in Hong Kong from 2017 to 2023 (in millions)Number of Facebook users in Hong Kong 2017-2023
- OECD countries: export value of coal, coke & briquettes from the UK 2010-14
- France: export value of coal, coke & briquettes from the UK 2010-2017
- France: export value of chemicals and products from the UK 2012-2017
- Morocco: export value of natural and manufactured gas from the UK 2010-14
- Ireland: export value of natural and manufactured gas from the UK 2010-14
- G7: export value of petroleum products from the UK 2010-14
- Canada: export value of petroleum products from the UK 2010-14
- Nigeria: export value of petroleum products from the UK 2010-14
- Venezuela: export value of mineral fuels & lubricants materials from the UK 2010-2017
- India: export value of mineral fuels & lubricants materials from the UK 2010-2017
- Sweden: export value of mineral fuels & lubricants materials from UK 2010-2017
- Japan: export value of mineral fuels & lubricants materials from the UK 2010-2017
- Turkey: export value of petroleum products from the UK 2010-14
- Netherlands: export value of petroleum products from the UK 2010-14
- Greece: export value of petroleum products from the UK 2010-14
- Export value of Qatar by category 2016
- Industrial supply export value of Qatar 2007-2016
- Nigeria: export value of textile yarn and related products from the UK 2012-2015
- Canada: export value of rubber manufactures from the United Kingdom (UK) 2012-17
- France: export value of textile yarn and related products from the UK 2012-2015
- U.S. export
- Exports from China
- Keep calm and Made in Italy - Rapporto Export 2018
- Recent Trends in U.S. Services Trade 2018
- Yearbook of Foreign Trade Statistics of Poland 2018
- Scotch Whisky Association Statistical Report 2015
- Recent Trends in U.S. Services Trade 2017
- Sveriges utrikeshandel med jordbruksvaror och livsmedel 2014-2016
- The Economic Impact of Scotch Whisky Production in the UK
- Recent Trends in U.S. Services Trade 2015
- Sveriges utrikeshandel med jordbruksvaror och livsmedel 2012-2014
- Sveriges utrikeshandel med jordbruksvaror och livsmedel 2013-2015
- Recent Trends in U.S. Services Trade 2011
- Recent Trends in U.S. Services Trade 2013
- Recent Trends in U.S. Services Trade 2012
- Volume of U.S. exports of trade goods to Hong Kong from 1985 to 2017 (in billion U.S. dollars)
- Countries with the highest average internet connection speed as of 1st quarter 2017 (in Mbps)
- Countries with the largest rate of high broadband connectivity as of 1st quarter 2017
- Number of internet users in the Asia Pacific region as of January 2018, by country (in millions)
- Number of mobile internet users in Hong Kong from 2017 to 2023 (in millions)
- Number of Facebook users in Hong Kong from 2017 to 2023 (in millions)
- Penetration of leading social networks in Hong Kong as of 3rd quarter 2017
- Internet users in selected countries in Asia Pacific who have made a purchase via mobile phone in 3rd quarter 2017
- Population of Hong Kong from 2009 to 2017 (in millions)
- Breakdown of population aged 15 and above in Hong Kong from 2008 to 2017, by gender
- Crude birth rate in Hong Kong from 2008 to 2017 (per 1,000 people)
- Life expectancy at birth in Hong Kong from 2008 to 2017, by gender
- Breakdown of population in Hong Kong as of August 2018, by language
- Land area of Hong Kong in 2017, by region (in square kilometers)
- Water consumption in Hong Kong from 2008 to 2017 (in million cubic meters)
- Electricity consumption in Hong Kong from 2008 to 2017, by use (in GWh)
- Hospital bed density in Hong Kong from 2008 to 2017 (in hospital beds per 1,000 inhabitants)
- Gross domestic product (GDP) in Hong Kong from 2006 to 2017 (in billion Hong Kong dollars)*
- Gross domestic product at current market prices of Hong Kong from 2007 to 2016, by sector (in billion Hong Kong dollars)
- Gross domestic product of the service industry in Hong Kong in 2016, by sector (in billion Hong Kong dollars)
- Consumer price index* (CPI) in Hong Kong from 2008 to 2017
- Forecast of retail sales growth in Hong Kong from 2008 to 2018, by volume
- Value of imports into Hong Kong in 2017, by region of origin (in billion Hong Kong dollars)
- Value of domestic exports from Hong Kong in 2017, by destination (in billion Hong Kong dollars)
- Hong Kong trade balance of services from 2009 to 2015 (in billion Hong Kong dollars)
- Merchandise trade balance of Taiwan with mainland China and Hong Kong from 2008 to 2017 (in billion U.S. dollars)
- Number of labor force in Hong Kong from 2008 to 2017, by gender (in 1,000 people)
- Number of employed people in Hong Kong in 2017, by monthly earnings
- Unemployment rate in Hong Kong from 2008 to 2017
- Top ten wealthiest people in Hong Kong, China as of January 2018 (in billion U.S. dollars)
- Government revenue in Hong Kong from 2008 to 2018 (in billion Hong Kong dollars)*
- Government expenditure in Hong Kong from 2008 to 2018 (in billion Hong Kong dollars)*
- Government reserve balances of Hong Kong from 2008 to 2017 (in billion Hong Kong dollars)
- Internet penetration in Asia as of June 2018, by country
- Number of monthly active social media users in Asia Pacific as of January 2018, by country (in millions)
- Social network user penetration in Hong Kong from 2017 to 2023
- Facebook usage penetration rate in Hong Kong from 2017 to 2023
- Value of exports of coal, coke and briquettes to the OECD countries from the United Kingdom (UK) from 2010 to 2014 (in 1,000s U.S. dollars)
- Value of exports of coal, coke and briquettes to France from the United Kingdom (UK) from 2010 to 2017 (in 1,000s U.S. dollars)
- Value of exports of chemicals and related products to France from the United Kingdom (UK) from 2012 to 2017 (in 1,000 U.S. dollars)
- Value of exports of natural and manufactured gas to Morocco from the United Kingdom (UK) from 2010 to 2014 (in 1,000 U.S. dollars)
- Value of exports of natural and manufactured gas to Ireland from the United Kingdom (UK) from 2010 to 2014 (in 1,000 U.S. dollars)
- Value of exports of petroleum, petroleum products and related materials to G7 countries from the United Kingdom (UK) from 2010 to 2014 (in 1,000 U.S. dollars)
- Value of exports of petroleum, petroleum products and related materials to Canada from the United Kingdom (UK) from 2010 to 2014 (in 1,000 U.S. dollars)
- Value of exports of petroleum, petroleum products and related materials to Nigeria from the United Kingdom (UK) from 2010 to 2014 (in 1,000 U.S. dollars)
- Value of exports of mineral fuels, lubricants and related materials to Venezuela from the United Kingdom (UK) from 2010 to 2017 (in 1,000 U.S. dollars)
- Value of exports of mineral fuels, lubricants and related materials to India from the United Kingdom (UK) from 2010 to 2017 (in 1,000 U.S. dollars)
- Value of exports of mineral fuels, lubricants and related materials to Sweden from the United Kingdom (UK) from 2010 to 2017 (in 1,000 U.S. dollars)
- Value of exports of mineral fuels, lubricants and related materials to Japan from the United Kingdom (UK) from 2010 to 2017 (in 1,000 U.S. dollars)
- Value of exports of petroleum, petroleum products and related materials to Turkey from the United Kingdom (UK) from 2010 to 2014 (in 1,000 U.S. dollars)
- Value of exports of petroleum, petroleum products and related materials to the Netherlands from the United Kingdom (UK) from 2010 to 2014 (in 1,000 U.S. dollars)
- Value of exports of petroleum, petroleum products and related materials to Greece from the United Kingdom (UK) from 2010 to 2014 (in 1,000 U.S. dollars)
- Value of exports and re-exports from Qatar in 2016, by category (in billion Qatari riyals)
- Value of industrial supply exports and re-exports from Qatar from 2007 to 2016 (in billion Qatari riyals)
- Value of exports of textile yarn and related products to Nigeria from the United Kingdom (UK) from 2012 to 2015 (in 1,000 U.S. dollars)
- Value of exports of rubber manufactures to Canada from the United Kingdom (UK) from 2012 to 2017 (in 1,000 U.S. dollars)
- Value of exports of textile yarn and related products to France from the United Kingdom (UK) from 2012 to 2015 (in 1,000 U.S. dollars)
Statista offers dossiers and reports on over 170 industries. With Statista you are always able to make informed decisions and boost your work efficiency.
Internet & Telecommunications
- Social Media
- E-Commerce
- Online Video & Entertainment
- Advertising & Marketing
Consumer Goods & FMCG
- Alcoholic Beverages
- Cleaning Products
- Cosmetics & Personal Care
- Food & Nutrition
Retail & Trade
- Health & Hygiene
- International Trade
- Shopping Behavior
- Sports & Leisure
Travel, Tourism & Hospitality
- Business Travel
- Leisure Travel
- Accomodation
- Restaurants
Society
- Demographics
- Economy
- Education & Science
- Politics & Government
Transportation & Logistics
- Aviation
- Rail Transport
- Vehicles & Road Traffic
- Water Transport
You can only download this statistic as a Premium user.
As a Premium user you get access to the detailed source references and background information about this statistic.
As a Premium user you get access to background information and details about the release of this statistic.
As soon as this statistic is updated, you will immediately be notified via e-mail.
You need at least a Premium Account to use this feature.
This feature is limited to our corporate solutions.
Please contact us to get started with full access to dossiers, forecasts, studies and international data.

The Italian pharmaceutical market is among the fastest growing ones worldwide. This dossier provides data on the trends of the market, with special focus on pharmaceutical segments.

To our 150 Reports we added:
- Global Consumer Survey content
- Operational risk index by Fitch
- And more …

The global plastics industry is growing by approximately three percent every year. This dossier provides information about the global plastics industry in general as well as chapters on the major types of plastic, and recycling rates.

Updates on eCommerce, Digital Media, eTravel, eServices and more
- Market figures for 2018 to 2023
- Company and startup profiles
- User demographics

U.S. coal production has steadily declined in the past decade, but has been in the news in recent years due to President Trump's desire to revitalize the industry. This document provides an overview of the key figures, leading companies, and the employment trends in the U.S. coal mining industry.

This new export feature offers
- Structured graphical representation of the data
- Tailored target group analysis
- Option for further processing

The Polish e-commerce market is one of the fastest developing e-commerce markets in Europe. The latest data for Poland is presented in this dossier.

Plastic waste is an issue of global concern. Since China banned the import of recycled plastic, the U.S. has had to make adjustments to its management of plastic waste. This dossier provides an overview of plastic waste in the U.S.

This dossier provides an overview of hedge funds worldwide. Global hedge fund assets, performance, investors, and other topics are highlighted.

The Outdoor Advertising Association of America covers amongst others
- Number of billboards
- Outdoor advertising revenue
- Number of out-of-home displays

Find data, perceptions & more about
- Economic consequences
- Impact on the labor market
- A second referendum

Understand the recent developments in the Spanish eCommerce market!
- URL-related revenues
- Relevant online store KPIs
- eCommerce-related contacts

- Extended statistical dossier
- Insights, explanations & interpretations
- Challenges of the digital future

eCommerce is rapidly becoming a part of the Latin American shopping culture. The dossier includes data on
- Regional online shopping events
- Events by country

The outline of potential impacts of Brexit on UK industries has been updated in the UK Industry Reports.

Italian enterprises invest significantly in digital marketing. Find out about
- Relevant aspects & KPIs
- New trends
- Different strategies

Statista European Football Benchmark
- The big 5 European leagues
- All about the clubs & fans
- Sponsors & how they fit in
We use cookies to personalize contents and ads, offer social media features, and analyze access to our website. In your browser settings you can configure or disable this, respectively, and can delete any already placed cookies. For details, please see your browser’s Help section (by pressing F1). Please see our privacy statement for details about how we use data.