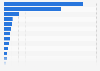
This statistic shows the gross domestic product (GDP) at current prices of Hong Kong from 2011 to 2021, by sector. In 2021, the industrial GDP of Hong Kong amounted to around 172 billion Hong Kong dollars.
Gross domestic product (GDP) at current market prices of Hong Kong from 2011 to 2021, by economic sector (in billion Hong Kong dollars)
Basic Account
Get to know the platform
You only have access to basic statistics.
This statistic is not included in your account.
Starter Account
The ideal entry-level account for individual users
- Instant access to 1m statistics
- Download in XLS, PDF & PNG format
- Detailed references
$229 USD $199 USD / Month *
in the first 12 months
Professional Account
Full access
Business Solutions including all features.
* Prices do not include sales tax.
Other statistics that may interest you Hong Kong
Population
5
- Premium Statistic Population of Hong Kong 1980-2022
- Premium Statistic Breakdown of population aged 15 and above in Hong Kong 2012-2022, by gender
- Premium Statistic Crude birth rate in Hong Kong 2012-2022
- Premium Statistic Life expectancy at birth in Hong Kong 2022, by gender
- Premium Statistic Breakdown of population in Hong Kong 2016, by language
Infrastructure
4
Economy
5
- Basic Statistic Gross domestic product (GDP) of Hong Kong 2000-2027
- Premium Statistic GDP of Hong Kong 2011-2021, by economic sector
- Premium Statistic Gross domestic product of the service industry in Hong Kong 2021, by sector
- Premium Statistic Consumer price index in Hong Kong 2012-2022
- Premium Statistic Retail sales growth in Hong Kong 2008-2018
Foreign trade
5
- Premium Statistic Imports into Hong Kong 2022, by region of origin
- Premium Statistic Exports from Hong Kong 2022, by destination
- Premium Statistic Services trade balance of Hong Kong 2011-2021
- Premium Statistic Merchandise trade balance of Taiwan with China and Hong Kong 2012-2022
- Basic Statistic U.S. exports of trade goods to Hong Kong 1985-2022
Employment and earnings
4
Government
3
Digital usage
8
- Premium Statistic Internet penetration Asia 2022, by country
- Basic Statistic Countries with the fastest average internet connection speed 2017
- Basic Statistic Countries with largest 10 Mbps broadband connectivity 2017
- Basic Statistic Number of internet users APAC 2021, by country
- Basic Statistic Mobile internet users in Hong Kong 2018-2027
- Premium Statistic Number of active social media users APAC 2023, by country
- Premium Statistic Social media penetration in Hong Kong 2018-2027
- Basic Statistic Number of Facebook users in Hong Kong 2018-2027
Further related statistics
18
- Industrial gross domestic product of Hong Kong 2021, by sector
- Industrial GDP of Macao 2021, by sector
- Annual growth of the real GDP in Nebraska 2000-2020
- Annual growth of the real GDP in South Carolina 2000-2020
- U.S. annual GDP growth in Missouri 2000-2022
- Gross domestic product of Hong Kong 2021, by expenditure component
- Gross national product (GNP) growth of Taiwan 2011-2021
- U.S. real value added to GDP in Alaska 2022, by industry
- U.S. real value added to GDP in Alabama 2022, by industry
- U.S. real value added to GDP in Idaho 2022, by industry
- U.S. real value added to GDP in Nebraska 2022, by industry
- U.S. real value added to GDP in South Carolina 2022, by industry
- U.S. annual GDP growth in Indiana 2000-2022
- Value of mineral fertilizer exports Egypt 2016 by destination
- Industry revenue of “other membership organizations“ in Georgia 2012-2024
- Industry revenue of “other membership organizations“ in Florida 2012-2024
- Industry revenue of “civic and social organizations“ in Illinois 2012-2024
- GDP contribution of electric power sector Myanmar FY 2010-2018
Further Content: You might find this interesting as well
Statistics
- Industrial gross domestic product of Hong Kong 2021, by sector
- Industrial GDP of Macao 2021, by sector
- Annual growth of the real GDP in Nebraska 2000-2020
- Annual growth of the real GDP in South Carolina 2000-2020
- U.S. annual GDP growth in Missouri 2000-2022
- Gross domestic product of Hong Kong 2021, by expenditure component
- Gross national product (GNP) growth of Taiwan 2011-2021
- U.S. real value added to GDP in Alaska 2022, by industry
- U.S. real value added to GDP in Alabama 2022, by industry
- U.S. real value added to GDP in Idaho 2022, by industry
- U.S. real value added to GDP in Nebraska 2022, by industry
- U.S. real value added to GDP in South Carolina 2022, by industry
- U.S. annual GDP growth in Indiana 2000-2022
- Value of mineral fertilizer exports Egypt 2016 by destination
- Industry revenue of “other membership organizations“ in Georgia 2012-2024
- Industry revenue of “other membership organizations“ in Florida 2012-2024
- Industry revenue of “civic and social organizations“ in Illinois 2012-2024
- GDP contribution of electric power sector Myanmar FY 2010-2018
Census and Statistics Department Hong Kong. (November 30, 2022). Gross domestic product (GDP) at current market prices of Hong Kong from 2011 to 2021, by economic sector (in billion Hong Kong dollars) [Graph]. In Statista. Retrieved October 01, 2023, from https://www.statista.com/statistics/317248/hong-kong-gross-domestic-product-by-sector/
Census and Statistics Department Hong Kong. "Gross domestic product (GDP) at current market prices of Hong Kong from 2011 to 2021, by economic sector (in billion Hong Kong dollars)." Chart. November 30, 2022. Statista. Accessed October 01, 2023. https://www.statista.com/statistics/317248/hong-kong-gross-domestic-product-by-sector/
Census and Statistics Department Hong Kong. (2022). Gross domestic product (GDP) at current market prices of Hong Kong from 2011 to 2021, by economic sector (in billion Hong Kong dollars). Statista. Statista Inc.. Accessed: October 01, 2023. https://www.statista.com/statistics/317248/hong-kong-gross-domestic-product-by-sector/
Census and Statistics Department Hong Kong. "Gross Domestic Product (Gdp) at Current Market Prices of Hong Kong from 2011 to 2021, by Economic Sector (in Billion Hong Kong Dollars)." Statista, Statista Inc., 30 Nov 2022, https://www.statista.com/statistics/317248/hong-kong-gross-domestic-product-by-sector/
Census and Statistics Department Hong Kong, Gross domestic product (GDP) at current market prices of Hong Kong from 2011 to 2021, by economic sector (in billion Hong Kong dollars) Statista, https://www.statista.com/statistics/317248/hong-kong-gross-domestic-product-by-sector/ (last visited October 01, 2023)
Gross domestic product (GDP) at current market prices of Hong Kong from 2011 to 2021, by economic sector (in billion Hong Kong dollars) [Graph], Census and Statistics Department Hong Kong, November 30, 2022. [Online]. Available: https://www.statista.com/statistics/317248/hong-kong-gross-domestic-product-by-sector/