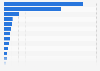
The timeline shows the Hong Kong trade balance of services from 2010 to 2020. In 2020, Hong Kong had a trade surplus of about 92.7 billion Hong Kong dollars in service trade, decreasing from around 164.7 billion Hong Kong dollars in 2019.
Services trade balance of Hong Kong from 2010 to 2020
(in billion Hong Kong dollars)
Profit from the additional features of your individual account
Currently, you are using a shared account. To use individual functions (e.g., mark statistics as favourites, set
statistic alerts) please log in with your personal account.
If you are an admin, please authenticate by logging in again.
Statista Accounts:
Access All Statistics. Starting from $468 / Year
Learn more about how Statista can support your business.
Census and Statistics Department Hong Kong. (February 15, 2022). Services trade balance of Hong Kong from 2010 to 2020 (in billion Hong Kong dollars) [Graph]. In Statista. Retrieved May 27, 2022, from https://www.statista.com/statistics/318790/hong-kong-services-trade-balance/
Census and Statistics Department Hong Kong. "Services trade balance of Hong Kong from 2010 to 2020 (in billion Hong Kong dollars)." Chart. February 15, 2022. Statista. Accessed May 27, 2022. https://www.statista.com/statistics/318790/hong-kong-services-trade-balance/
Census and Statistics Department Hong Kong. (2022). Services trade balance of Hong Kong from 2010 to 2020 (in billion Hong Kong dollars). Statista. Statista Inc.. Accessed: May 27, 2022. https://www.statista.com/statistics/318790/hong-kong-services-trade-balance/
Census and Statistics Department Hong Kong. "Services Trade Balance of Hong Kong from 2010 to 2020 (in Billion Hong Kong Dollars)." Statista, Statista Inc., 15 Feb 2022, https://www.statista.com/statistics/318790/hong-kong-services-trade-balance/
Census and Statistics Department Hong Kong, Services trade balance of Hong Kong from 2010 to 2020 (in billion Hong Kong dollars) Statista, https://www.statista.com/statistics/318790/hong-kong-services-trade-balance/ (last visited May 27, 2022)