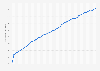
This statistic presents the home ownership rate among the population of all 28 European Union countries between 2010 and 2018. During that timeframe, the home ownership rate remained relatively stable, oscillating around approximately 69 percent of the total of the population.
Home ownership rate in the European Union (28 countries) from 2010 to 2018
Loading statistic...
Basic Account
Get to know the platform
You only have access to basic statistics.
Starter Account
The ideal entry-level account for individual users
- Instant access to 1m statistics
- Download in XLS, PDF & PNG format
- Detailed references
$69 USD $49 USD / Month *
in the first 12 months
Professional Account
Full access
Business Solutions including all features.
* Prices do not include sales tax.
Other statistics that may interest you
Households
8
- Basic Statistic Number of U.S. households, by type 2021
- Basic Statistic Percentage of U.S. households, by type 1990-2022
- Basic Statistic Number of households in the U.S. 1960-2022
- Basic Statistic Average size of households in the U.S. 1960-2022
- Basic Statistic Number of U.S. households 2021, by state
- Basic Statistic Average size of U.S. households 2021, by state
- Basic Statistic Number of households in the U.S. by size of household 1970-2022
- Basic Statistic Distribution of households in the U.S. 1970-2021, by household size
Families
7
- Basic Statistic Number of families in the U.S. 1960-2022
- Basic Statistic Average size of U.S. families 2021, by state
- Basic Statistic U.S. families income distribution 2021, by race and origin
- Basic Statistic U.S. number of families with a single father 1990-2021
- Basic Statistic Number of families with a single mother U.S. 1990-2021
- Basic Statistic U.S. family households with children, by family type 1970-2021
- Premium Statistic Number of families in the US by number of children 2000-2022
Marriage and divorce
8
- Basic Statistic Marital status of the U.S. population 2021, by sex
- Premium Statistic Number of marriages in the U.S. 1990-2021
- Premium Statistic Number of divorces in the U.S. 1981-2020
- Premium Statistic USA - Marriage rate 1990-2021
- Premium Statistic U.S. - divorce rate 1990-2021
- Premium Statistic Marriage rates in the U.S. 2021, by state
- Premium Statistic U.S. - divorce rate 2020, by state
- Basic Statistic Number of married couples U.S. 2022, by race and Hispanic origin
Further related statistics
18
- Home ownership rate in North Macedonia 2011-2016
- Home ownership rate in Denmark 2008-2017
- Home ownership rate in Sweden 2008-2019
- Home ownership rate in Estonia 2008-2017
- Home ownership rate in Serbia 2013-2016
- Home ownership rate in Ireland 2007-2019
- Home ownership rate in Iceland 2007-2016
- Home ownership rate in Croatia 2010-2016
- Home ownership rate in Turkey 2008-2015
- Home ownership rate in Greece 2008-2017
- Home ownership rate in Belgium 2008-2017
- Home ownership rate in Poland 2008-2017
- Home ownership rate in Romania 2008-2017
- Home ownership rate in Bulgaria 2008-2017
- Home ownership rate in Portugal 2008-2017
- Home ownership rate in Switzerland 2010-2016
- Home ownership rate in Czechia 2008-2017
- Home ownership rate in Slovakia 2007-2016
Further Content: You might find this interesting as well
Statistics
- Home ownership rate in North Macedonia 2011-2016
- Home ownership rate in Denmark 2008-2017
- Home ownership rate in Sweden 2008-2019
- Home ownership rate in Estonia 2008-2017
- Home ownership rate in Serbia 2013-2016
- Home ownership rate in Ireland 2007-2019
- Home ownership rate in Iceland 2007-2016
- Home ownership rate in Croatia 2010-2016
- Home ownership rate in Turkey 2008-2015
- Home ownership rate in Greece 2008-2017
- Home ownership rate in Belgium 2008-2017
- Home ownership rate in Poland 2008-2017
- Home ownership rate in Romania 2008-2017
- Home ownership rate in Bulgaria 2008-2017
- Home ownership rate in Portugal 2008-2017
- Home ownership rate in Switzerland 2010-2016
- Home ownership rate in Czechia 2008-2017
- Home ownership rate in Slovakia 2007-2016
Eurostat. (May 9, 2020). Home ownership rate in the European Union (28 countries) from 2010 to 2018 [Graph]. In Statista. Retrieved June 10, 2023, from https://www.statista.com/statistics/503864/house-owners-among-european-union-eu-28-population/
Eurostat. "Home ownership rate in the European Union (28 countries) from 2010 to 2018." Chart. May 9, 2020. Statista. Accessed June 10, 2023. https://www.statista.com/statistics/503864/house-owners-among-european-union-eu-28-population/
Eurostat. (2020). Home ownership rate in the European Union (28 countries) from 2010 to 2018. Statista. Statista Inc.. Accessed: June 10, 2023. https://www.statista.com/statistics/503864/house-owners-among-european-union-eu-28-population/
Eurostat. "Home Ownership Rate in The European Union (28 Countries) from 2010 to 2018." Statista, Statista Inc., 9 May 2020, https://www.statista.com/statistics/503864/house-owners-among-european-union-eu-28-population/
Eurostat, Home ownership rate in the European Union (28 countries) from 2010 to 2018 Statista, https://www.statista.com/statistics/503864/house-owners-among-european-union-eu-28-population/ (last visited June 10, 2023)
Home ownership rate in the European Union (28 countries) from 2010 to 2018 [Graph], Eurostat, May 9, 2020. [Online]. Available: https://www.statista.com/statistics/503864/house-owners-among-european-union-eu-28-population/