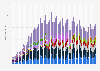
The statistic shows the number of mobile augmented reality applications worldwide in the consumer market from 2016 to 2022. In 2016, the installed base of apps with embedded AR stood at 340.8 million worldwide.
Consumer mobile device augmented reality applications (embedded/standalone) worldwide from 2016 to 2022 (in millions)*
Profit from the additional features of your individual account
Currently, you are using a shared account. To use individual functions (e.g., mark statistics as favourites, set
statistic alerts) please log in with your personal account.
If you are an admin, please authenticate by logging in again.
Learn more about how Statista can support your business.
Tractica. (September 30, 2017). Consumer mobile device augmented reality applications (embedded/standalone) worldwide from 2016 to 2022 (in millions)* [Graph]. In Statista. Retrieved September 21, 2024, from https://www.statista.com/statistics/608967/mobile-ar-applications-installed-base-worldwide/
Tractica. "Consumer mobile device augmented reality applications (embedded/standalone) worldwide from 2016 to 2022 (in millions)*." Chart. September 30, 2017. Statista. Accessed September 21, 2024. https://www.statista.com/statistics/608967/mobile-ar-applications-installed-base-worldwide/
Tractica. (2017). Consumer mobile device augmented reality applications (embedded/standalone) worldwide from 2016 to 2022 (in millions)*. Statista. Statista Inc.. Accessed: September 21, 2024. https://www.statista.com/statistics/608967/mobile-ar-applications-installed-base-worldwide/
Tractica. "Consumer Mobile Device Augmented Reality Applications (Embedded/Standalone) Worldwide from 2016 to 2022 (in Millions)*." Statista, Statista Inc., 30 Sep 2017, https://www.statista.com/statistics/608967/mobile-ar-applications-installed-base-worldwide/
Tractica, Consumer mobile device augmented reality applications (embedded/standalone) worldwide from 2016 to 2022 (in millions)* Statista, https://www.statista.com/statistics/608967/mobile-ar-applications-installed-base-worldwide/ (last visited September 21, 2024)
Consumer mobile device augmented reality applications (embedded/standalone) worldwide from 2016 to 2022 (in millions)* [Graph], Tractica, September 30, 2017. [Online]. Available: https://www.statista.com/statistics/608967/mobile-ar-applications-installed-base-worldwide/