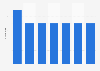
The statistic presents data on the number of movies nominated for the Academy Award for Best Picture in 2018 consumers have seen in the United States as of February 2018. During a survey, 22 percent of respondents stated they had seen one to two movies nominated for Best Picture in 2018.
How many of the movies nominated for Best Picture in 2018 have you already seen?
Loading statistic...
Basic Account
Get to know the platform
You only have access to basic statistics.
Starter Account
The ideal entry-level account for individual users
- Instant access to 1m statistics
- Download in XLS, PDF & PNG format
- Detailed references
$149 USD / Month *
Professional Account
Full access
Business Solutions including all features.
* Prices do not include sales tax.
Other statistics that may interest you Statistics on
About the industry
10
- Basic Statistic Consumers who saw or heard of the movie “Call Me by Your Name” in the U.S. 2018
- Basic Statistic Consumers who saw or heard of the movie “Lady Bird” in the U.S. 2018
- Basic Statistic Consumers who saw or heard of the movie “Mudbound” in the U.S. 2018
- Basic Statistic Consumers who saw or heard of the movie “Roman J. Israel, Esq.” in the U.S. 2018
- Premium Statistic Frequency of going to the movies in the U.S. 2022, by ethnicity
- Premium Statistic Frequency of going to the movies in the U.S. 2022, by household income
- Premium Statistic Public opinion on Ben Affleck as actor/director in the U.S. 2019
- Premium Statistic Impact of director gender on movie consumption in the U.S. 2019
- Premium Statistic Movie fans in the U.S. 2019
- Premium Statistic Impact of director gender on movie consumption in the U.S. 2019, by age
About the region
10
- Premium Statistic Movie fans in the U.S. 2019, by gender
- Premium Statistic Impact of director producer on movie consumption in the U.S. 2019
- Premium Statistic Awareness of female movie directors in the U.S. 2019, by age
- Premium Statistic Public opinion of Christopher Nolan in the U.S. 2019
- Premium Statistic Public opinion of Martin Scorsese in the U.S. 2019
- Premium Statistic Public opinion of James Cameron in the U.S. 2019
- Premium Statistic Public opinion of Guillermo del Toro in the U.S. 2019
- Premium Statistic Public opinion on Angelina Jolie as actor/director in the U.S. 2019
- Premium Statistic Public opinion on Bradley Cooper as actor/director in the U.S. 2019
- Premium Statistic Preferred place of movie consumption in the U.S. 2018, by age group
Selected statistics
2
Other regions
10
- Premium Statistic Cinema attendance in Sweden 2009-2022
- Premium Statistic Digital 3D screens in European countries 2018
- Basic Statistic Number of cinema admissions in Norway 2010-2022
- Basic Statistic Revenue share generated by movies after Oscar nomination in the U.S. 2019
- Premium Statistic Ranking of cinema movies in Denmark April 2019, by number of admissions
- Premium Statistic Number of cinema visits per year in Germany 2001-2022, by age group
- Premium Statistic Leading film distributors in the Netherlands 2022, by revenue
- Premium Statistic Number of film and video companies in Finland 2021, by sector
- Premium Statistic Cinema attendance at foreign films in Russia 2015-2022
- Premium Statistic Digital cinema screens in the Czech Republic 2009-2018
Related statistics
10
- Premium Statistic Preferred place of movie consumption in the U.S. 2018, by ethnicity
- Premium Statistic Preferred place of movie consumption in the U.S. 2018, by family income
- Premium Statistic Tickets to 3D films as a percentage of total cinema attendance in Norway 2011-2022
- Premium Statistic Distribution of theatrical movie releases in Sweden 2021, by origin
- Premium Statistic Frequency of going to the movies in the U.S. 2022, by gender
- Premium Statistic Domestic films' cinema attendance in Norway 2010-2021
- Premium Statistic Number of cinema admissions to 3D films in Norway 2009-2021
- Premium Statistic 3D films' box office revenue as a share of total box office gross in Norway 2011-2021
- Premium Statistic Market share of film distributors in Sweden 2020
- Premium Statistic Digital 3D screens in Europe 2009-2018
Further related statistics
9
- Per capita consumer spending in India 1974-2012
- Life insurance coverage sentiment in the U.S. 2016, by age
- Loyalty program ownership in U.S. restaurants as of November 2013, by restaurant type
- Resources shoppers use most often to make purchase decisions in the UK 2013
- Consumers willingness to share personal data with retailers in the UK in 2013, by age
- Where consumers shop for clothing and footwear in the United Kingdom (UK) 2013
- Channels consumers use for their main grocery shop in the United Kingdom (UK) 2013
- Coffee shops, tea shops and cafes: where consumers go in the United Kingdom (UK) 2013
- Hairdressing and beauty: Where consumers access services in the United Kingdom 2013
Further Content: You might find this interesting as well
Statistics
- Per capita consumer spending in India 1974-2012
- Life insurance coverage sentiment in the U.S. 2016, by age
- Loyalty program ownership in U.S. restaurants as of November 2013, by restaurant type
- Resources shoppers use most often to make purchase decisions in the UK 2013
- Consumers willingness to share personal data with retailers in the UK in 2013, by age
- Where consumers shop for clothing and footwear in the United Kingdom (UK) 2013
- Channels consumers use for their main grocery shop in the United Kingdom (UK) 2013
- Coffee shops, tea shops and cafes: where consumers go in the United Kingdom (UK) 2013
- Hairdressing and beauty: Where consumers access services in the United Kingdom 2013
YouGov. (March 2, 2018). How many of the movies nominated for Best Picture in 2018 have you already seen? [Graph]. In Statista. Retrieved December 08, 2023, from https://www.statista.com/statistics/805654/number-movies-seen-nominated-pest-picture/
YouGov. "How many of the movies nominated for Best Picture in 2018 have you already seen?." Chart. March 2, 2018. Statista. Accessed December 08, 2023. https://www.statista.com/statistics/805654/number-movies-seen-nominated-pest-picture/
YouGov. (2018). How many of the movies nominated for Best Picture in 2018 have you already seen?. Statista. Statista Inc.. Accessed: December 08, 2023. https://www.statista.com/statistics/805654/number-movies-seen-nominated-pest-picture/
YouGov. "How Many of The Movies Nominated for Best Picture in 2018 Have You Already Seen?." Statista, Statista Inc., 2 Mar 2018, https://www.statista.com/statistics/805654/number-movies-seen-nominated-pest-picture/
YouGov, How many of the movies nominated for Best Picture in 2018 have you already seen? Statista, https://www.statista.com/statistics/805654/number-movies-seen-nominated-pest-picture/ (last visited December 08, 2023)
How many of the movies nominated for Best Picture in 2018 have you already seen? [Graph], YouGov, March 2, 2018. [Online]. Available: https://www.statista.com/statistics/805654/number-movies-seen-nominated-pest-picture/