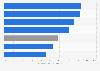
This statistic illustrates the unemployment rate of urban residents in the United States in 2015, by neighborhood type. In that year, 6.3 percent urban residents who lived in mixed-use districts, which include residential housing, retail areas, and major employment centers, were unemployed.
Unemployment rate of urban residents in the United States in 2015, by neighborhood type*
Basic Account
Get to know the platform
You only have access to basic statistics.
This statistic is not included in your account.
Starter Account
The ideal entry-level account for individual users
- Instant access to 1m statistics
- Download in XLS, PDF & PNG format
- Detailed references
$69 USD $49 USD / Month *
in the first 12 months
Professional Account
Full access
Business Solutions including all features.
* Prices do not include sales tax.
Other statistics that may interest you
Overview
3
Key demographic figures
7
- Premium Statistic Infant mortality rate Vietnam 2021, by urbanization level
- Premium Statistic Sex ratio at birth among urban and rural population in Vietnam 2010-2021
- Premium Statistic Sex ratio among urban and rural population in Vietnam 2010-2021
- Premium Statistic Poverty rate in in urban and rural areas Vietnam 2016-2021
- Premium Statistic Households with clean water access in urban and rural Vietnam 2010-2021
- Premium Statistic Households with electricity access in urban and rural Vietnam 2010-2021
- Premium Statistic House ownership among urban households Vietnam 2020, by house type
Cities
7
- Basic Statistic GDP contribution Vietnam 2021, by province
- Premium Statistic GRDP growth rate of centrally-controlled cities Vietnam 2021
- Premium Statistic Provincial competitiveness index (PCI) rank of Ha Noi Vietnam 2010-2021
- Premium Statistic HCMC's provincial competitiveness index (PCI) rank Vietnam 2010-2021
- Premium Statistic Average rent price of office property in Ha Noi and Ho Chi Minh City Vietnam Q2 2022
- Premium Statistic Average prime retail rent in Ha Noi and Ho Chi Minh City in Vietnam Q2 2022
- Premium Statistic Average apartment price in Ha Noi and Ho Chi Minh City in Vietnam Q2 2022
Population density
7
- Basic Statistic Population density of Vietnam 2011-2021
- Premium Statistic Major urban cities' population density in Vietnam 2021
- Premium Statistic Ho Chi Minh City's population density 2011-2021
- Premium Statistic Ha Noi's population density 2011-2021
- Basic Statistic Hai Phong's population density 2011-2021
- Premium Statistic Da Nang's population density 2011-2021
- Premium Statistic Can Tho's population density 2011-2021
Income
7
- Premium Statistic Urban versus rural monthly average income per capita in Vietnam 2010-2021
- Premium Statistic Monthly average income per capita in five urban cities Vietnam 2021
- Premium Statistic Monthly average income per capita in Ho Chi Minh City Vietnam 2010-2021
- Premium Statistic Monthly average income per capita in Ha Noi Vietnam 2010-2021
- Premium Statistic Monthly average income per capita in Hai Phong Vietnam 2010-2021
- Premium Statistic Monthly average income per capita in Da Nang Vietnam 2010-2021
- Premium Statistic Monthly average income per capita in Can Tho Vietnam 2010-2021
Consumption
7
- Premium Statistic Annual in-home FMCG value growth in urban areas Vietnam 2012-2021
- Premium Statistic Most chosen FMCG brands in urban areas Vietnam 2021, by penetration rate
- Premium Statistic Most chosen food brands in urban areas Vietnam 2021, by penetration rate
- Premium Statistic Most chosen beverages brands in urban areas Vietnam 2021, by penetration rate
- Premium Statistic Most chosen dairy brands in urban areas Vietnam 2021, by penetration rate
- Premium Statistic Most chosen home care brands in rural areas Vietnam 2021, by penetration rate
- Premium Statistic Most chosen health and beauty brands in urban areas Vietnam 2021, by penetration rate
Further related statistics
8
- Median age of urban residents in the U.S., by neighborhood type 2015
- Share of urban households with children in the U.S., by neighborhood type 2015
- Distribution of urban population in the U.S., by neighborhood type 2015
- Distribution of urban employment in the U.S., by neighborhood type 2015
- Household rural-urban distribution of car or van ownership in England 2014-2015
- Social renters satisfaction with neighborhood in the UK 2013-2017
- Global unemployment rate by age 2011
- Unemployment rate in Catalonia 2021, by age group and gender
Further Content: You might find this interesting as well
Statistics
- Median age of urban residents in the U.S., by neighborhood type 2015
- Share of urban households with children in the U.S., by neighborhood type 2015
- Distribution of urban population in the U.S., by neighborhood type 2015
- Distribution of urban employment in the U.S., by neighborhood type 2015
- Household rural-urban distribution of car or van ownership in England 2014-2015
- Social renters satisfaction with neighborhood in the UK 2013-2017
- Global unemployment rate by age 2011
- Unemployment rate in Catalonia 2021, by age group and gender
Urban Land Institute. (June 7, 2018). Unemployment rate of urban residents in the United States in 2015, by neighborhood type* [Graph]. In Statista. Retrieved June 05, 2023, from https://www.statista.com/statistics/955273/unemployment-rate-urban-residents-us-neighborhood-type/
Urban Land Institute. "Unemployment rate of urban residents in the United States in 2015, by neighborhood type*." Chart. June 7, 2018. Statista. Accessed June 05, 2023. https://www.statista.com/statistics/955273/unemployment-rate-urban-residents-us-neighborhood-type/
Urban Land Institute. (2018). Unemployment rate of urban residents in the United States in 2015, by neighborhood type*. Statista. Statista Inc.. Accessed: June 05, 2023. https://www.statista.com/statistics/955273/unemployment-rate-urban-residents-us-neighborhood-type/
Urban Land Institute. "Unemployment Rate of Urban Residents in The United States in 2015, by Neighborhood Type*." Statista, Statista Inc., 7 Jun 2018, https://www.statista.com/statistics/955273/unemployment-rate-urban-residents-us-neighborhood-type/
Urban Land Institute, Unemployment rate of urban residents in the United States in 2015, by neighborhood type* Statista, https://www.statista.com/statistics/955273/unemployment-rate-urban-residents-us-neighborhood-type/ (last visited June 05, 2023)
Unemployment rate of urban residents in the United States in 2015, by neighborhood type* [Graph], Urban Land Institute, June 7, 2018. [Online]. Available: https://www.statista.com/statistics/955273/unemployment-rate-urban-residents-us-neighborhood-type/