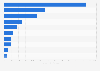
This statistic shows the retail sales value of personal and household care products in Saudi Arabia in 2018, with estimates from 2019 to 2025. In 2018, the retail sales value of personal and household care products amounted to 11.9 billion U.S. dollars. It was expected that the retail sales value would reach 18.9 billion U.S. dollars by 2025.
Retail sales value of personal and household care products in Saudi Arabia from 2018 to 2025* (in billion U.S. dollars)
Basic Account
Get to know the platform
You only have access to basic statistics.
This statistic is not included in your account.
Starter Account
The ideal entry-level account for individual users
- Instant access to 1m statistics
- Download in XLS, PDF & PNG format
- Detailed references
$149 USD / Month *
Professional Account
Full access
Business Solutions including all features.
* Prices do not include sales tax.
Other statistics that may interest you Statistics on
About the industry
10
- Premium Statistic Retail sales of cosmetics & toiletries in Hungary 2015-2022
- Basic Statistic Cosmetic and toiletries: retail sales volume index monthly in Great Britain 2016-2023
- Basic Statistic Per capita sales in health and personal care stores in the U.S. 2000-2021
- Premium Statistic Size of the tissue paper market U.S. 2017-2025
- Premium Statistic Size of the tissue paper market U.S. 2017-2025, by product segment
- Premium Statistic Retail sales of the tissue industry in the United States in 2017, by segment
- Premium Statistic Retail volume of the tissue industry in the U.S. from 2011 to 2021, by segment
- Premium Statistic Dollar sales of personal care products in U.S. C-stores 2022, by segment
- Premium Statistic Henkel: share of sales in Western Europe 2009-2022
- Basic Statistic Cosmetics & toilet articles: quarterly sales volume index in Great Britain 2015-2023
About the region
10
- Premium Statistic Average monthly household expenditure in Saudi Arabia 2018
- Premium Statistic Retail expenditure on consumer electronics Saudi Arabia 2018-2025
- Premium Statistic Retail sales forecast Saudi Arabia 2018-2025
- Premium Statistic Penetration rate of online grocery retail Saudi Arabia 2017-2025
- Premium Statistic Retail expenditure on food and non-alcoholic beverages Saudi Arabia 2018-2025
- Premium Statistic Retail expenditure on accessories Saudi Arabia 2018-2025
- Premium Statistic Retail expenditure on apparel and footwear Saudi Arabia 2018-2025
- Premium Statistic Retail expenditure on home appliances Saudi Arabia 2018-2025
- Premium Statistic Value of beauty sales in Saudi Arabia in 2015 and 2020
- Premium Statistic Indices for cost of living for furnishings and housing goods Saudi Arabia 2014-2020
Selected statistics
6
- Basic Statistic Sales growth of leading moist towelette brands in the U.S. 2010/2011
- Basic Statistic Sales share of L'Oréal's global cosmetic branch 2022, by business segment
- Premium Statistic Sales share of L'Oréal's global cosmetic branch 2022, by geographic zone
- Premium Statistic Global advertising expenditure of Colgate-Palmolive 2009-2022
- Premium Statistic Consolidated sales of L'Oréal worldwide 2012-2021, by branch
- Premium Statistic Percentage of deodorant soap sales in the U.S. 2007/2008, by vendor
Other regions
9
- Premium Statistic Gross margin of Matas 2012-2023
- Basic Statistic Monthly cosmetic and toiletry retail sales value index in Great Britain 2016-2023
- Basic Statistic Monthly household expenditures on consumer goods France 2019-2022, by category
- Premium Statistic U.S. household lawn and garden retail sales 2010-2016
- Premium Statistic Number of furniture, household & lighting equipment shops in Hungary 2012-2022
- Premium Statistic Tools, supplies & support options used when cleaning at home in Germany 2019
- Premium Statistic Importance of household cleaning product attributes in Thailand 2016
- Premium Statistic Market value of men's grooming products in India 2011-2016
- Premium Statistic Monthly household expenditure in Myanmar 2012, by state
Related statistics
10
- Premium Statistic Retail trade and wholesale as share of GDP in Kuwait 2012 to 2019
- Premium Statistic Sales of food and non-alcoholic beverages in domestic consumption in Dubai 2018
- Premium Statistic Domestic food sales share in Dubai 2018, by category
- Premium Statistic Export share in Dubai 2017, by category
- Premium Statistic Domestic non--alcoholic beverages sales share in Dubai 2018, by category
- Premium Statistic Annual sales growth rate of coffee, tea and other hot drinks in Dubai 2017-2020
- Premium Statistic Value of retail trade in Kuwait 2012-2016
- Premium Statistic Value of retail trade in Bahrain 2012-2016
- Premium Statistic Retail trade and wholesale as share of GDP in Qatar 2012-2017
- Premium Statistic Packaged sauces, dressings and condiments retail sales value in the UAE 2010-2015
Further related statistics
10
- John Lewis sales revenue in the United Kingdom (UK) 2009-2023
- Waitrose sales revenue in the United Kingdom (UK) 2009-2023
- Tesco's sales worldwide 2016/2017-2022/2023, by region
- Sales of Johnson & Johnson worldwide 2011-2022, by segment
- Johnson & Johnson's number of employees 2004-2022
- Electrical appliances retail sales volume index in Great Britain (UK) 2013-2022
- Secondhand goods: Sales volume percentage change in Great Britain (UK) 2013-2022
- Global advertising costs of The Clorox Company 2011-2023
- Distribution of monthly magazine sales in the United Kingdom (UK) 2019, by sector
- Alcohol and tobacco sales volume percentage increase in Great Britain (UK) 2011-2019
Further Content: You might find this interesting as well
Statistics
- John Lewis sales revenue in the United Kingdom (UK) 2009-2023
- Waitrose sales revenue in the United Kingdom (UK) 2009-2023
- Tesco's sales worldwide 2016/2017-2022/2023, by region
- Sales of Johnson & Johnson worldwide 2011-2022, by segment
- Johnson & Johnson's number of employees 2004-2022
- Electrical appliances retail sales volume index in Great Britain (UK) 2013-2022
- Secondhand goods: Sales volume percentage change in Great Britain (UK) 2013-2022
- Global advertising costs of The Clorox Company 2011-2023
- Distribution of monthly magazine sales in the United Kingdom (UK) 2019, by sector
- Alcohol and tobacco sales volume percentage increase in Great Britain (UK) 2011-2019
Delta Partners. (January 1, 2019). Retail sales value of personal and household care products in Saudi Arabia from 2018 to 2025* (in billion U.S. dollars) [Graph]. In Statista. Retrieved December 07, 2023, from https://www.statista.com/statistics/990090/saudi-arabia-retail-sales-of-personal-and-household-care/
Delta Partners. "Retail sales value of personal and household care products in Saudi Arabia from 2018 to 2025* (in billion U.S. dollars)." Chart. January 1, 2019. Statista. Accessed December 07, 2023. https://www.statista.com/statistics/990090/saudi-arabia-retail-sales-of-personal-and-household-care/
Delta Partners. (2019). Retail sales value of personal and household care products in Saudi Arabia from 2018 to 2025* (in billion U.S. dollars). Statista. Statista Inc.. Accessed: December 07, 2023. https://www.statista.com/statistics/990090/saudi-arabia-retail-sales-of-personal-and-household-care/
Delta Partners. "Retail Sales Value of Personal and Household Care Products in Saudi Arabia from 2018 to 2025* (in Billion U.S. Dollars)." Statista, Statista Inc., 1 Jan 2019, https://www.statista.com/statistics/990090/saudi-arabia-retail-sales-of-personal-and-household-care/
Delta Partners, Retail sales value of personal and household care products in Saudi Arabia from 2018 to 2025* (in billion U.S. dollars) Statista, https://www.statista.com/statistics/990090/saudi-arabia-retail-sales-of-personal-and-household-care/ (last visited December 07, 2023)
Retail sales value of personal and household care products in Saudi Arabia from 2018 to 2025* (in billion U.S. dollars) [Graph], Delta Partners, January 1, 2019. [Online]. Available: https://www.statista.com/statistics/990090/saudi-arabia-retail-sales-of-personal-and-household-care/