Skip to main content
Consumer Goods & FMCG
E-Commerce
Economy & Politics
Energy & Environment
Health, Pharma & Medtech
Internet
Media
Technology & Telecommunications
Transportation & Logistics
Travel, Tourism & Hospitality
View all industries
Global data volume growth
Global AI market size
Number of generative AI users worldwide
Global inflation rate
Retail e-commerce sales worldwide
Largest economies worldwide
Biggest social media platforms by users
Global EV market share by manufacturer
International tourist arrivals by world region
Global annual CO₂ emissions
Browse recent statistics
Artificial intelligence (AI) worldwide
TikTok
Nvidia
E-commerce worldwide
Global GDP
Instagram
Apparel market worldwide
Video gaming worldwide
Global renewable energy industry
Influencer marketing worldwide
Browse recent topics
Consumer Trends 2026
Artificial Intelligence: in-depth market analysis
E-commerce challenges
Global economy
TikTok
Luxury goods: in-depth market analysis
Electric vehicles: A global overview
Video gaming worldwide
Travel and tourism trends 2026
Battery recycling worldwide
Browse recent reports
Explore the tool
Explore Classic mode
Advertising & Media
eCommerce
Consumer
Finance
Global Indicators
Health
Industrial
Mobility
Technology
Explore Market Insights
eCommerce Insights
Research AI
Book a demo
All integrations
Developer docs
Explore Statista Connect
Research
Strategy & Consulting
Marketing
Media & PR
Explore AI assistants
Marketing
Research & Development
Strategy
Sales
Find the fact
Tell the story
Win the pitch
Understand the market
Develop your strategy
Academia
Agencies
Consultancies
Consumer goods
Finance
Tech
Research solutions
Strategy consulting
Communication services
Explore Statista+
Statista R
Statista Healthcare
About Statista
First steps & help center
Webinar & training hub
Success stories
Individuals & Small Teams
Businesses & Enterprises
Academia & Government
English
Deutsch
Daily Data
Global stories vividly visualized
Savings
Sep 26, 2016
This chart shows responses to the question "how much money do you have in your savings account?"
More Information
Generosity
Sep 23, 2016
This chart shows the percentage of people who donated money to charity in the past month.
More Information
Health
Sep 23, 2016
This chart shows health-related SGD index scores worldwide in 2015.
More Information
Arms
Sep 23, 2016
This chart shows arms exports from Central & Eastern Europe to the Middle East since 2012.
More Information
Wage Gap
Sep 22, 2016
This chart shows average hourly real wages and the wage gap in the U.S. from 1979 to 2015.
More Information
Smoking
Sep 22, 2016
This chart shows the percentage of 15 & 16 year-old students who used cigarettes in the past 30 days.
More Information
Obesity
Sep 21, 2016
Tihis chart shows fire services with the highest number of batriatric rescues in 2015-16.
More Information
UK Wine Imports
Sep 21, 2016
This chart shows the countries of origin for the UK's best selling wines in 2015/2016.
More Information
UK Confectionery
Sep 21, 2016
This chart shows UK sales growth of the top confectionery formats in 2015/2016.
More Information
UK Chocolate
Sep 21, 2016
This chart shows UK sales of the top confectionery manufacturers in 2015/2016.
More Information
Car Sharing
Sep 21, 2016
This chart shows taxes on a one-hour car rental in selected U.S. cities in 2016.
More Information
Election 2016
Sep 21, 2016
This chart shows the predicted impact of Trump & Clinton's proposed economic policies.
More Information
Tech Industry Investment
Sep 21, 2016
This chart shows the investment rounds received by UK-based tech companies in August 2016.
More Information
Food Waste
Sep 20, 2016
This chart shows the five most commonly wasted food types in Britain.
More Information
Food Industry
Sep 20, 2016
This chart shows year on year growth in meat and poultry sales in the UK.
More Information
Business Jets
Sep 20, 2016
This chart shows the number of business jets registered worldwide in 2014.
More Information
NHS
Sep 20, 2016
This chart shows the number of written complaints received by Hospital and Community Health Services in 2015-16.
More Information
Teachers
Sep 20, 2016
This chart shows the average starting salary for elementary school teachers in selected OECD countries in 2014.
More Information
Violent Non-Sate Actors
Sep 20, 2016
This chart shows which groups that employ violence for political ends were most active or deadly in 2015.
More Information
Marketing
Sep 20, 2016
This chart shows consumer attitudes towards ad personalisation in the UK, Germany and France
More Information
Child marriage
Sep 20, 2016
This chart shows the minimum marriage age for boys and girls in 2015.
More Information
UN Aid Convoy Attack
Sep 20, 2016
This chart shows the number of aid workers killed from 2005 to 2015.
More Information
Obesity
Sep 19, 2016
This graphic shows the number of rescues performed for obese people by UK fire services.
More Information
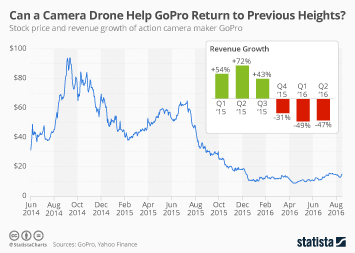
GoPro Unveils Its First Camera Drone
Sep 19, 2016
This chart shows the stock price and revenue growth of action camera maker GoPro.
More Information
Driving
Sep 19, 2016
This chart shows attitudes of drivers in the UK to handheld mobile phone use while driving.
More Information
Cheese
Sep 19, 2016
This chart shows the countries which imported the most UK cheese in 2015.
More Information
Bonuses
Sep 19, 2016
This chart shows the average annual bonus per employee by industry in the UK.
More Information
Education
Sep 19, 2016
This chart shows the average salary for priomary teachers with 10 years experience in 2014.
More Information
New York Bombs
Sep 19, 2016
This chart shows the approximate location of the recent bombs in New York.
More Information
Cleaning Products
Sep 16, 2016
This chart looks at the cleaning products sector in the UK.
More Information
Official Launch of the iPhone 7 and 7 Plus
Sep 16, 2016
This chart shows launch weekend sales for previous iPhone releases.
More Information
Ice Cream Industry
Sep 16, 2016
This chart shows the sector values and year on year changes in sales of ice cream in the UK.
More Information
Ice Cream Industry
Sep 16, 2016
This chart shows the UK ice cream market value share, by retailer.
More Information
College Fees
Sep 16, 2016
This chart shows the highest increase in yearly tuition fees at 4-year public schools (2000-2015).
More Information
Startups
Sep 16, 2016
This chart shows the percentage change in the share of new businesses in U.S. metro areas since 2009.
More Information
Mergers & Acquisions
Sep 15, 2016
This chart shows the upward development of proposals made by Bayer for the takeover of Monsanto
More Information
Sustainability
Sep 15, 2016
This chart shows global cities ranked on 3 dimensions of sustainability in 2016.
More Information
Music Streaming
Sep 15, 2016
This chart shows how many people use selected online platforms to listen to music.
More Information
U.S. Gun Market
Sep 15, 2016
This chart shows the estimated global revenue/number of guns made annually for the US civilian market.
More Information
Commercial Use of Drones
Sep 14, 2016
This chart shows what American consumers think of potential drone delivery services.
More Information
NFL Week 2
Sep 14, 2016
This chart looks back at all rookie quarterbacks since 2011 and compares their week one and two performances.
More Information
Britain
Sep 14, 2016
This chart shows "the top ten things that make you most proud to be British".
More Information
Neighbors
Sep 14, 2016
This chart shows the percentage of residents who agree that they "often say hello to their neighbors and know who they are".
More Information
Birthdays
Sep 13, 2016
This chart shows the average number of daily births per month in the UK from 1995 to 2014.
More Information
Salary
Sep 13, 2016
This chart shows median bonuses for jobs in the UK in 2016.
More Information
Ailing in the Oval Office
Sep 13, 2016
This chart shows some of the health issues selected US presidents had been afflicted with.
More Information
Election 2016
Sep 13, 2016
This chart shows the opinions of Trump & Clinton supporters on various issues.
More Information
Quality of Life
Sep 13, 2016
This chart shows the worst ranked local/unitary authorities for girls in England & Wales.
More Information
Rape
Sep 13, 2016
This chart shows conviction rates of rape prosecutions in the UK from 2009 to 2016.
More Information
Britain
Sep 13, 2016
This chart shows median household wealth by region in the UK in 2016.
More Information
Millionaires
Sep 13, 2016
This chart shows the number of millionaires by region in the UK in 2016.
More Information
AirPods
Sep 12, 2016
This chart shows the cost of selected items compared to Apple's AirPods.
More Information
Homicides
Sep 12, 2016
This chart shows homicides in Chicago compared to American war dead in Iraq & Afghanistan since 2001.
More Information
Syria Ceasefire
Sep 12, 2016
This chart shows the number of deaths in the Syrian Civil War from 2011 to August 2016.
More Information
Gun Control Measures
Sep 9, 2016
This chart shows the support of supporters of presidential nominees Donald Trump and Hillary Clinton on gun policy related issue.
More Information
Apple Keynote
Sep 8, 2016
This infographic shows the markup on iPhones since 2011.
More Information
50th Anniversary
Sep 8, 2016
This chart shows budgets and revenue of Star Trek movies since the first episode of the franchise opened in 1979.
More Information
Cities
Sep 8, 2016
This chart shows global cities ranked by unfriendliness in 2016.
More Information
iPhone
Sep 8, 2016
This chart shows the iPhone's share of Apple's total revenue since 2007.
More Information
Psychiatrists
Sep 8, 2016
This chart shows the number of psychiatrists per 100,000 people in 2014 (selected countries).
More Information
UK Crime
Sep 8, 2016
This graphic analyses anti-Muslim crimes and incidents in the UK in 2015.
More Information
Alcohol
Sep 8, 2016
This chart shows American drinkers' beverage of choice from 1992 to 2016.
More Information
Apple Unveils New iPhone Models
Sep 7, 2016
This chart shows how Apple's share of smartphone sales in the United States and major European markets fluctuates through the year.
More Information
Mass shootings
Sep 7, 2016
This chart shows countries with the most mass shootings from 1966 to 2012.
More Information
Religious clothing
Sep 7, 2016
This chart shows the perrcentage of people agreeing it is up to a woman to dress whichever way she wants.
More Information
Headphone Market in the United States
Sep 6, 2016
This chart provides a breakdown of headphone sales in the United States in June 2016.
More Information
Drones
Sep 6, 2016
This chart shows the value of drone powered solutions to industries in 2015.
More Information
Business
Sep 6, 2016
This chart shows the length of time U.S. firms with employees have been in business.
More Information
German politics
Sep 6, 2016
Share of vote received by Alternative für Deutschland in regional elections.
More Information
New Crime Report
Sep 6, 2016
This chart shows how prosecutions for violence against women and girls in the UK have increased from 2014/15 to 2015/16.
More Information
Universities
Sep 6, 2016
This chart shows the number of international students at U.S. universities in 2014/15.
More Information
Refugee crisis
Sep 6, 2016
This chart shows pledged places as a percentage of 'fair share' based on size of economy.
More Information
European Union
Sep 5, 2016
This chart shows electricity consumption of EU households in 2014 (MWh per capita).
More Information
Film Industry Pay Gap
Sep 5, 2016
This chart shows the earnings of the top-paid male and female actors in 2015/2016.
More Information
Parenting
Sep 5, 2016
This chart shows reasons parents regretted their choice of first/middle names for their children.
More Information
Inequality
Sep 5, 2016
This chart shows the percentage difference in hourly wages between women and men in the UK.
More Information
Alternative für Deutschland
Sep 5, 2016
This chart shows the percentage of votes received by German right-wing party AfD in regional elections.
More Information
Apps
Sep 5, 2016
This chart shows the number of apps in the iOS App Store by visibility.
More Information
Silicon Valley Property Prices
Sep 5, 2016
This chart shows how property prices in Silicon Valley (Palo Alto) have developed from 2006 to 2016.
More Information
Transfer Window
Sep 2, 2016
This chart shows 2016-17 summer transfer window spending.
More Information
Presidential Cookie Poll
Sep 2, 2016
This chart shows the winners of the presidential cookie contest and consecutive US presidents since 1992.
More Information
Births
Sep 1, 2016
This chart shows live births and nationality of mothers born outside the UK (England & Wales).
More Information
Back-to-school
Sep 1, 2016
This chart shows some of the key numbers behind back-to-school in the U.S.
More Information
Transfer Deadline Day
Sep 1, 2016
This chart shows spending in the Premier League's summer transfer window from season 12/13 to season 16/17.
More Information
Airbnb
Sep 1, 2016
This chart shows the percentage of active Airbnb listings that are commercial across U.S. cities in 2016.
More Information
iPhone
Sep 1, 2016
This chart shows the average cost of an iPhone 6 worldwide in 2016 (U.S. dollars).
More Information
US Open
Sep 1, 2016
This chart compares Serena Williams and Steffi Graf on Grand Slams won and weeks as world number one.
More Information
Tech Jobs
Sep 1, 2016
This chart shows areas with the greatest increase in technology jobs (2010-2015).
More Information
Natural Disasters
Sep 1, 2016
This chart shows the strongest known earthquakes ever to hit Europe.
More Information
Murder rates
Aug 31, 2016
This chart shows homicides per 100,000 inhabitants in 2015.
More Information
137
/
161
Contact
Get in touch with us. We are happy to help.
Do you still have questions?
Feel free to contact us anytime using our
contact form
or visit our
FAQ page
.
Your contact to the Infographics Newsroom
Felix Richter
Data Journalist
felix.richter@statista.com
+49 (40) 284 841 557