Skip to main content
Consumer Goods & FMCG
E-Commerce
Economy & Politics
Energy & Environment
Health, Pharma & Medtech
Internet
Media
Technology & Telecommunications
Transportation & Logistics
Travel, Tourism & Hospitality
View all industries
Global data volume growth
Global AI market size
Number of generative AI users worldwide
Global inflation rate
Retail e-commerce sales worldwide
Largest economies worldwide
Biggest social media platforms by users
Global EV market share by manufacturer
International tourist arrivals by world region
Global annual CO₂ emissions
Browse recent statistics
Artificial intelligence (AI) worldwide
TikTok
Nvidia
E-commerce worldwide
Global GDP
Instagram
Apparel market worldwide
Video gaming worldwide
Global renewable energy industry
Influencer marketing worldwide
Browse recent topics
Consumer Trends 2026
Artificial Intelligence: in-depth market analysis
E-commerce challenges
Global economy
TikTok
Luxury goods: in-depth market analysis
Electric vehicles: A global overview
Video gaming worldwide
Travel and tourism trends 2026
Battery recycling worldwide
Browse recent reports
Explore the tool
Explore Classic mode
Advertising & Media
eCommerce
Consumer
Finance
Global Indicators
Health
Industrial
Mobility
Technology
Explore Market Insights
eCommerce Insights
Research AI
Book a demo
All integrations
Developer docs
Explore Statista Connect
Research
Strategy & Consulting
Marketing
Media & PR
Explore AI assistants
Marketing
Research & Development
Strategy
Sales
Find the fact
Tell the story
Win the pitch
Understand the market
Develop your strategy
Academia
Agencies
Consultancies
Consumer goods
Finance
Tech
Research solutions
Strategy consulting
Communication services
Explore Statista+
Statista R
Statista Healthcare
About Statista
First steps & help center
Webinar & training hub
Success stories
Individuals & Small Teams
Businesses & Enterprises
Academia & Government
English
Deutsch
Daily Data
Infographics on the topic "uk"
Drugs
Oct 31, 2016
This chart shows the results of a global survey on the use of 'legal highs' in the last 12 months.
More Information
Education
Oct 31, 2016
This infographic shows the most common countries of origin of international students studying in the UK.
More Information
Brexit
Oct 31, 2016
This chart shows responses to the question: "If Brexit meant the following, how would it impact your view on leaving?"
More Information
Organic Farming
Oct 28, 2016
This chart shows the total organic farming area in EU countries in 2015.
More Information
LGBT
Oct 28, 2016
This chart shows the percentage of the population identifying as LGBT in selected countries in 2016.
More Information
Languages
Oct 26, 2016
This chart shows the average salary in jobs requiring the following languages in the UK.
More Information
Anti-ISIS Coalition Conference in Paris
Oct 25, 2016
This chart shows the most common type of targets of ISIS and the weapons used by the jihadists
More Information
Wine
Oct 25, 2016
This chart shows annual per capita wine consumption worldwide.
More Information
Stress at Work
Oct 24, 2016
This infographic shows the most dangerous workplace hazards according to UK safety representatives in 2016.
More Information
Mobile Broadband
Oct 24, 2016
This chart shows the availability and speed of 4G in the UK, by region.
More Information
UK Politics
Oct 21, 2016
This chart shows the share of votes received by the top five candidates in Batley & Spen and Witney by-elections.
More Information
Top Worries
Oct 20, 2016
This chart shows the percentage in each country considering the following topics their top worry in September 2016.
More Information
Brexit Fallout
Oct 19, 2016
This chart shows selected currencies according to their year-to-date change in exchange rate against the U.S. dollar.
More Information
Killer Clowns
Oct 14, 2016
This chart shows the number of calls received by Childline regarding 'creepy clowns'.
More Information
Brexit
Oct 14, 2016
This chart shows the percentage of respondents who regret their vote in the UK's EU referendum (Oct 16).
More Information
Government Budget Policies
Oct 13, 2016
This chart shows what the British public thinks about budgetary priorities
More Information
Personal Savings
Oct 13, 2016
This chart shows the share of the UK adult population with less than £100 of savings, by country/region.
More Information
Slavery
Oct 12, 2016
This chart shows the number of female and male modern slavery victims assisted by the Salvation Army.
More Information
World Obesity Day
Oct 11, 2016
This chart shows the share of UK boys that are forecast to be obese by 2020, by social category.
More Information
Voice Calls
Oct 11, 2016
This infographic shows the share of UK smartphone users that made a voice call in the previous 7 days from 2012 to 2016.
More Information
United Kingdom
Oct 10, 2016
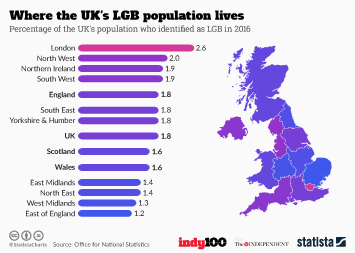
This chart shows the percentage of the UK's population who identified as LGB in 2016
More Information
Brexit
Oct 7, 2016
This chart shows an EU referendum voting breakdown by whether respondents have family/friends in the EU.
More Information
Brexit
Oct 7, 2016
This chart shows the number of British applications for Irish passports in 2015 & 2016 (excluding Northern Ireland).
More Information
Reading
Oct 7, 2016
This chart shows hours spend reading per person per week in selected countries.
More Information
Startups
Oct 6, 2016
This chart shows the world's most expensive offices located in creative districts.
More Information
Pensions
Oct 6, 2016
This infographic looks at the extra annual savings required to supplement the average pension to an adequate level.
More Information
Migration
Oct 5, 2016
This infographic shows a comparison of man-made barriers around the world
More Information
London
Oct 5, 2016
This chart shows the percentage feeling uncomfortable chatting to a seemingly-normal stranger in the UK.
More Information
Refugees
Oct 5, 2016
This chart shows the top countries by the number of refugees hosted at the end of 2015.
More Information
Energy efficiency
Oct 4, 2016
This chart shows energy efficiency rankings of major countries in 2016.
More Information
Global Economy
Oct 4, 2016
This chart shows index scores about the countries with the most competitive economies.
More Information
Pollution deaths
Oct 4, 2016
This chart shows annual deaths from PM2.5 and PM10 pollution per 100,000 inhabitants.
More Information
Startups
Oct 4, 2016
This chart shows the most expensive 600 sq ft offices located in creative districts.
More Information
Languages
Sep 27, 2016
This chart shows the percentage share of pupils learning a foreign language at primary level.
More Information
Obesity
Sep 21, 2016
Tihis chart shows fire services with the highest number of batriatric rescues in 2015-16.
More Information
UK Wine Imports
Sep 21, 2016
This chart shows the countries of origin for the UK's best selling wines in 2015/2016.
More Information
UK Confectionery
Sep 21, 2016
This chart shows UK sales growth of the top confectionery formats in 2015/2016.
More Information
UK Chocolate
Sep 21, 2016
This chart shows UK sales of the top confectionery manufacturers in 2015/2016.
More Information
Tech Industry Investment
Sep 21, 2016
This chart shows the investment rounds received by UK-based tech companies in August 2016.
More Information
Food Waste
Sep 20, 2016
This chart shows the five most commonly wasted food types in Britain.
More Information
Food Industry
Sep 20, 2016
This chart shows year on year growth in meat and poultry sales in the UK.
More Information
NHS
Sep 20, 2016
This chart shows the number of written complaints received by Hospital and Community Health Services in 2015-16.
More Information
Marketing
Sep 20, 2016
This chart shows consumer attitudes towards ad personalisation in the UK, Germany and France
More Information
UN Aid Convoy Attack
Sep 20, 2016
This chart shows the number of aid workers killed from 2005 to 2015.
More Information
Obesity
Sep 19, 2016
This graphic shows the number of rescues performed for obese people by UK fire services.
More Information
Driving
Sep 19, 2016
This chart shows attitudes of drivers in the UK to handheld mobile phone use while driving.
More Information
Cheese
Sep 19, 2016
This chart shows the countries which imported the most UK cheese in 2015.
More Information
Bonuses
Sep 19, 2016
This chart shows the average annual bonus per employee by industry in the UK.
More Information
Cleaning Products
Sep 16, 2016
This chart looks at the cleaning products sector in the UK.
More Information
Ice Cream Industry
Sep 16, 2016
This chart shows the sector values and year on year changes in sales of ice cream in the UK.
More Information
Ice Cream Industry
Sep 16, 2016
This chart shows the UK ice cream market value share, by retailer.
More Information
Sustainability
Sep 15, 2016
This chart shows global cities ranked on 3 dimensions of sustainability in 2016.
More Information
Britain
Sep 14, 2016
This chart shows "the top ten things that make you most proud to be British".
More Information
Birthdays
Sep 13, 2016
This chart shows the average number of daily births per month in the UK from 1995 to 2014.
More Information
Salary
Sep 13, 2016
This chart shows median bonuses for jobs in the UK in 2016.
More Information
Quality of Life
Sep 13, 2016
This chart shows the worst ranked local/unitary authorities for girls in England & Wales.
More Information
Rape
Sep 13, 2016
This chart shows conviction rates of rape prosecutions in the UK from 2009 to 2016.
More Information
Britain
Sep 13, 2016
This chart shows median household wealth by region in the UK in 2016.
More Information
Millionaires
Sep 13, 2016
This chart shows the number of millionaires by region in the UK in 2016.
More Information
50th Anniversary
Sep 8, 2016
This chart shows budgets and revenue of Star Trek movies since the first episode of the franchise opened in 1979.
More Information
Cities
Sep 8, 2016
This chart shows global cities ranked by unfriendliness in 2016.
More Information
UK Crime
Sep 8, 2016
This graphic analyses anti-Muslim crimes and incidents in the UK in 2015.
More Information
Apple Unveils New iPhone Models
Sep 7, 2016
This chart shows how Apple's share of smartphone sales in the United States and major European markets fluctuates through the year.
More Information
Religious clothing
Sep 7, 2016
This chart shows the perrcentage of people agreeing it is up to a woman to dress whichever way she wants.
More Information
German politics
Sep 6, 2016
Share of vote received by Alternative für Deutschland in regional elections.
More Information
New Crime Report
Sep 6, 2016
This chart shows how prosecutions for violence against women and girls in the UK have increased from 2014/15 to 2015/16.
More Information
Refugee crisis
Sep 6, 2016
This chart shows pledged places as a percentage of 'fair share' based on size of economy.
More Information
Parenting
Sep 5, 2016
This chart shows reasons parents regretted their choice of first/middle names for their children.
More Information
Inequality
Sep 5, 2016
This chart shows the percentage difference in hourly wages between women and men in the UK.
More Information
Births
Sep 1, 2016
This chart shows live births and nationality of mothers born outside the UK (England & Wales).
More Information
Natural Disasters
Sep 1, 2016
This chart shows the strongest known earthquakes ever to hit Europe.
More Information
Rio 2016
Aug 30, 2016
This chart shows all the countries who competed in Rio and previously had an athlete suspended for doping.
More Information
UK's racial divide
Aug 25, 2016
This chart shows working age unemployment by region and ethnicity.
More Information
Rio
Aug 23, 2016
This chart shows gold medals won by Team GB at the Summer Olympics (1996-2016).
More Information
Liveable cities
Aug 19, 2016
This chart shows global cities ranked by liveability in 2016.
More Information
Graduate Jobs
Aug 19, 2016
This chart shows the average starting salary for graduates in the UK in 2016.
More Information
New Report
Aug 19, 2016
This chart displays facts and figures signifying race inequality in the UK.
More Information
Career
Aug 19, 2016
This chart shows the top childhood job ambitions among today's adults.
More Information
Gamescom
Aug 18, 2016
This graphic focuses on the UK video games industry for the year ending March 2016.
More Information
House prices
Aug 18, 2016
This chart shows the development of the average UK house price from June 2008 to June 2016.
More Information
Rio Olympics
Aug 17, 2016
This chart shows the number of medals won by Great Britain at the Summer Olympics since 1976.
More Information
Darknet
Aug 16, 2016
This chart shows where the most online vendors of illegal drugs are based and what their monthly revenue is.
More Information
Cost of Football
Aug 15, 2016
This infographic shows the cost of a season ticket at the most expensive football clubs in Europe.
More Information
Brexit
Aug 15, 2016
This chart shows the top-5 brands favoured by Leave & Remain voters in the UK.
More Information
Macro Economics
Aug 12, 2016
This chart shows the resulting change in a country's GDP when the capital city is taken out of the calculation.
More Information
Chief executive salary
Aug 9, 2016
This chart shows total pay for FTSE 100 CEOs in 2015.
More Information
Aug 5, 2016
This chart shows the cost of poverty compared to public spending in the UK in 2016-17.
More Information
Aug 3, 2016
This chart provides an overview of the death penalty and executions worldwide in 2015.
More Information
Aug 3, 2016
This chart shows index rankings of top countries for soft power in 2016.
More Information
Jul 29, 2016
This chart shows the NHS end-of-year financial results.
More Information
21
/
25
Contact
Get in touch with us. We are happy to help.
Do you still have questions?
Feel free to contact us anytime using our
contact form
or visit our
FAQ page
.
Your contact to the Infographics Newsroom
Felix Richter
Data Journalist
felix.richter@statista.com
+49 (40) 284 841 557