Skip to main content
Consumer Goods & FMCG
E-Commerce
Economy & Politics
Energy & Environment
Health, Pharma & Medtech
Internet
Media
Technology & Telecommunications
Transportation & Logistics
Travel, Tourism & Hospitality
View all industries
Global data volume growth
Global AI market size
Number of generative AI users worldwide
Global inflation rate
Retail e-commerce sales worldwide
Largest economies worldwide
Biggest social media platforms by users
Global EV market share by manufacturer
International tourist arrivals by world region
Global annual CO₂ emissions
Browse recent statistics
Artificial intelligence (AI) worldwide
TikTok
Nvidia
E-commerce worldwide
Global GDP
Instagram
Apparel market worldwide
Video gaming worldwide
Global renewable energy industry
Influencer marketing worldwide
Browse recent topics
Consumer Trends 2026
Artificial Intelligence: in-depth market analysis
E-commerce challenges
Global economy
TikTok
Luxury goods: in-depth market analysis
Electric vehicles: A global overview
Video gaming worldwide
Travel and tourism trends 2026
Battery recycling worldwide
Browse recent reports
Explore the tool
Explore Classic mode
Advertising & Media
eCommerce
Consumer
Finance
Global Indicators
Health
Industrial
Mobility
Technology
Explore Market Insights
eCommerce Insights
Research AI
Book a demo
All integrations
Developer docs
Explore Statista Connect
Research
Strategy & Consulting
Marketing
Media & PR
Explore AI assistants
Marketing
Research & Development
Strategy
Sales
Find the fact
Tell the story
Win the pitch
Understand the market
Develop your strategy
Academia
Agencies
Consultancies
Consumer goods
Finance
Tech
Research solutions
Strategy consulting
Communication services
Explore Statista+
Statista R
Statista Healthcare
About Statista
First steps & help center
Webinar & training hub
Success stories
Individuals & Small Teams
Businesses & Enterprises
Academia & Government
English
Deutsch
Daily Data
Infographics on the topic "uk"
Trump & Russia
Mar 21, 2017
This chart shows American public views on possible contact between Donald Trump's campaign and Russia.
More Information
Results
Mar 16, 2017
This chart shows the results of the Dutch general election 2017.
More Information
UK Budget
Mar 15, 2017
This chart shows important financial details of the 2017 UK budget.
More Information
Mosul
Mar 8, 2017
This chart shows the number of people displaced from Mosul (Oct 16-Mar 17).
More Information
Education
Mar 3, 2017
This chart shows the share of graduates saying their bachelor degree was or was not worthwhile in 2017.
More Information
Super-Rich
Mar 3, 2017
This chart shows growth rates for UHNWIs in selected countries from 2016 to 2026.
More Information
Article 50
Mar 3, 2017
This chart shows how Brexit voters would vote if a second referendum were to be held.
More Information
Immigration
Feb 28, 2017
This chart shows Americans' thought on Trump's border wall with Mexico.
More Information
Cyber Crime
Feb 27, 2017
This chart shows the share and number of DDoS attacks in Q4 2916, by country of origin.
More Information
Cars
Feb 24, 2017
This chart shows the UK cities where commuters spent the longest stuck in traffic in 2016.
More Information
War Economics
Feb 24, 2017
This chart shows the number of tanks and self-propelled guns produced from 1939 to 1945
More Information
Brexit
Feb 23, 2017
This chart shows how people in the UK imagine their country's foreign relations post-Brexit.
More Information
Chores
Feb 23, 2017
This chart shows percentage of people in the UK who enjoy/dislike the following household chore.
More Information
Employment
Feb 22, 2017
This chart shows the share of foreign-born workers in selected employment sectors 2015 in the UK
More Information
Donald Trump
Feb 21, 2017
This chart shows approval ratings for US presidents after one month in office.
More Information
Employment
Feb 21, 2017
This chart shows the % of people who find their job boring or not.
More Information
Takeover Bid
Feb 17, 2017
This chart pulls together key figures to compare Kraft Heinz and Unilever.
More Information
London House Prices
Feb 17, 2017
This chart shows the average house price across London boroughs in November 2016.
More Information
Digital Civility
Feb 15, 2017
This chart shows digital civility index scores by country.
More Information
Scottish Independence
Feb 14, 2017
This chart shows attitudes towards independence in Scotland.
More Information
G7
Feb 9, 2017
This chart shows the average annual real GDP growth rate of G7 countries from 2016 to 2050.
More Information
Brexit
Feb 8, 2017
This chart shows respondent's evaluation of the relationship between the UK and the EU (in %)
More Information
Innovation
Feb 6, 2017
This chart shows the number of patent applications per 100,000 published in 2015.
More Information
Donald Trump
Feb 6, 2017
This chart shows the % of people in the US who approve/disapprove of Trump's executive orders.
More Information
Donald Trump
Feb 3, 2017
This chart shows the thoughts of British people on U.S. President Donald Trump right now.
More Information
NATO
Feb 1, 2017
This chart shows the composition of NATO forces stationed in Eastern Europe.
More Information
Border Wall
Jan 27, 2017
This chart shows the top US imports from Mexico in 2015.
More Information
E-Commerce
Jan 26, 2017
This chart shows annual e-commerce growth rates in the UK from 2009 to 2017.
More Information
Primates
Jan 26, 2017
This chart shows the % of global primate species threatened and with declining populations in 2017.
More Information
Immigration
Jan 26, 2017
This chart shows countries where Trump is expected to announce immigration restrictions.
More Information
Torture
Jan 26, 2017
This chart shows agreement with the statement "torture is justified in some cases to protect the public".
More Information
Brexit
Jan 25, 2017
This chart shows the % saying that each Brexit negotiationg target is "the right thing to do".
More Information
Donald Trump
Jan 25, 2017
This chart shows the % thinking Donald Trump will be a good/bad president in selected countries.
More Information
Brexit
Jan 24, 2017
This chart shows what Brexit scenarios the British want (total, remainers and leavers, in percent)
More Information
U.S. Foreign Policy
Jan 23, 2017
This chart shows the number of U.S. bombs dropped in countries in 2016.
More Information
Revenue ranking of football clubs
Jan 19, 2017
This chart ranks the world's largest football clubs in terms of non-transfer revenue generated in the 2015/16 season.
More Information
Chief Executives
Jan 19, 2017
This chart shows the % rating CEOs as extremely/very credible in selected countries in 2017.
More Information
Brexit
Jan 17, 2017
This chart shows what British & German business executives think are the most important advantages & disadvantages of the EU
More Information
Brexit
Jan 16, 2017
This chart shows the countries most optimistic and pessimistic about the EU's future in Dec 2016.
More Information
HIV
Jan 11, 2017
This chart shows the top-10 countries for new HIV cases in Europe in 2015.
More Information
Weather
Jan 11, 2017
This chart illustrates the average number of snow falling days within the snowiest places in the UK
More Information
Transgender Rights
Jan 6, 2017
This chart shows the level of agreeement with transgender rights in selected countries.
More Information
Aviation Safety
Jan 5, 2017
This chart shows the number of fatal airliner accidents from 2000 to 201.
More Information
Optimism
Jan 4, 2017
This chart shows the % of respondents in selected countries agreeing 2017 will be better than 2016.
More Information
Saudi Arabia
Jan 3, 2017
This chart shows the estimated number of annual executions carried out in Saudi Arabia from 2007 to 2016.
More Information
Newspapers in decline
Jan 2, 2017
This chart illustrates the ongoing decline of local newspapers in the United Kingdom.
More Information
Amazon Echo sold out online
Dec 22, 2016
This chart sums up some facts about Amazon's Echo speakers.
More Information
Christmas
Dec 22, 2016
This chart shows the most requested toys in letters sent to Santa via the Royal Mail in 2016.
More Information
Perils Of Perception
Dec 16, 2016
This chart shows responses to the question "out of every 100 people in your country, how many do you think are Muslim?"
More Information
Burqa Ban
Dec 14, 2016
This chart shows responses to the question "to what extent would you support/oppose a law banning the burqa in the UK?"
More Information
Advertising and Marketing
Dec 12, 2016
This chart shows how many people agree or disagree that businesses try too hard by using emojis in advertising and communications
More Information
Euro
Dec 7, 2016
This chart shows the % who see the euro as a good/bad thing for their own country.
More Information
Music Industry
Dec 7, 2016
This chart shows the value of vinyl and digital album sales in the UK in Week 48 of 2015 and 2016.
More Information
Immigration
Dec 7, 2016
This chart shows the % agreeing that "there are so many foreigners living here, it doesn't feel like home any more".
More Information
Arms Trade
Dec 7, 2016
This chart shows the top arms-producing and military services companies in 2015.
More Information
Religion
Dec 7, 2016
This chart shows the results of a survey regarding a 'burqa ban' in Germany, USA and UK in 2016.
More Information
Christmas
Dec 5, 2016
This chart shows forecast Christmas spending in 2016.
More Information
European Union
Dec 1, 2016
This chart shows the percentage of Europeans who disapprove/approve of the EU's handling of economic issues.
More Information
Work
Dec 1, 2016
This chart shows the estimated annual cost of sleep deprivation in the UK in GDP terms.
More Information
Life Expectancy
Nov 30, 2016
This chart shows the life expectancy of males and females from birth in the UK in years (2013 to 2015).
More Information
Article 50
Nov 30, 2016
This chart shows the stance of UK MPs in the EU referendum by party.
More Information
UK SME
Nov 30, 2016
This chart compares the amount of hard/software a small business would get for £50 thousand pre- and post-Brexit.
More Information
Economy
Nov 28, 2016
this chart shows a breakdown of real estate transaction volume share in Europe from 2015 to 2016.
More Information
Soccer
Nov 28, 2016
This chart shows the cost of seeing one goal based on 2015/16 ticket prices and home results.
More Information
UKIP
Nov 28, 2016
This chart shows responses to the question: "on average, how often do you wear your underpants/knickers before washing them?"
More Information
Europe
Nov 25, 2016
This chart shows the % of young people (18-24) considering moving to another country in 2016.
More Information
Drugs
Nov 25, 2016
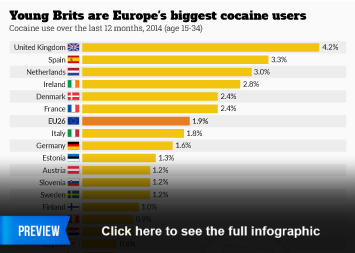
This chart shows cocaine use over the last 12 months, 2014 (age 15-34).
More Information
Voice Assistants
Nov 24, 2016
This chart shows the share of UK smartphone users that use an assistant app and for which purpose.
More Information
Election 2016
Nov 24, 2016
This chart shows what UK survey respondents think will happen with Trump as US President.
More Information
Hate Crimes
Nov 23, 2016
This chart shows the number of anti-Muslim assaults reported to the FBI from 2000 to 2015.
More Information
Royal Family
Nov 22, 2016
This chart shows the economic benefits and costs of the royal family in 2015.
More Information
Drugs
Nov 21, 2016
This chart shows the average maximum years of imprisonment for drug possession in 2016.
More Information
Infidelity
Nov 21, 2016
This chart shows the percentage of married adults who have admitted having an affair.
More Information
Jihadist Recruitment
Nov 18, 2016
This chart shows the number of known foreign fighters from European towns and cities.
More Information
European Union
Nov 16, 2016
This chart shows the average expected years of working life in the EU in 2015.
More Information
European Union
Nov 14, 2016
This chart shows non-EU citizens ordered to leave member states and share of total orders in 2015.
More Information
2016 Election
Nov 14, 2016
This chart shows total votes cast by voters across the United States in presidential elections.
More Information
Election 2016
Nov 11, 2016
This chart compares international markets after the first full day of trading following Brexit and the 2016 U.S. election.
More Information
Drugs
Nov 10, 2016
This chart shows the number of vendors/monthly revenue of online illegal drug sellers.
More Information
2016 Election
Nov 9, 2016
This chart shows US voter share by age.
More Information
2016 Election
Nov 9, 2016
This chart shows the percentage of US adults who rated the following presidential candidates unfavourable.
More Information
Reputable Cities
Nov 8, 2016
This chart shows the top scoring cities by reputability in 2016.
More Information
2016 Election
Nov 7, 2016
This chart shows the percentage of adults who would be afraid if Trump or Clinton was elected president.
More Information
Brexit
Nov 7, 2016
This chart shows MPs' declared EU referendum stances as of 22 June 2016.
More Information
Segregation in the UK
Nov 4, 2016
This chart shows the white British population across local authority districts in England.
More Information
Europe
Nov 4, 2016
This chart shows Europeans' opinions on the greatest policy achievements of the EU.
More Information
Smart Home
Nov 3, 2016
This chart compares the estimated spending on Smart Home security in the United States, the United Kingdom and in Germany to the risk...
More Information
Best Countries
Nov 3, 2016
This chart shows the top scoring countries in the inaugral "Best Countries" ranking in 2016.
More Information
Salary
Nov 3, 2016
This chart shows average annual salary before tax in the UK in 2016.
More Information
House Prices
Nov 3, 2016
This chart shows the median sale price of a home in London from 2000 to 2015.
More Information
20
/
25
Contact
Get in touch with us. We are happy to help.
Do you still have questions?
Feel free to contact us anytime using our
contact form
or visit our
FAQ page
.
Your contact to the Infographics Newsroom
Felix Richter
Data Journalist
felix.richter@statista.com
+49 (40) 284 841 557