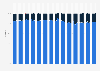
In 2021, most Hungarians estimated that between one to two percent of the calls they had received over the past year were sales calls. Another five percent of respondents claimed that over half of the calls they had received came from telesales.
Could you estimate what percentage of the calls you have received over the past year were sales calls?
Basic Account
Get to know the platform
You only have access to basic statistics.
This statistic is not included in your account.
Starter Account
The ideal entry-level account for individual users
- Instant access to 1m statistics
- Download in XLS, PDF & PNG format
- Detailed references
$149 USD / Month *
Professional Account
Full access
Business Solutions including all features.
* Prices do not include sales tax.
Other statistics that may interest you Statistics on
About the industry
10
- Premium Statistic Importance of selected marketing strategies to luxury watch brands in 2017
- Premium Statistic Share of consumers waiting for discounts in the Netherlands 2021, by category
- Premium Statistic Most popular sales periods in the Netherlands 2021
- Premium Statistic Most common impulse purchases in the Netherlands 2021, by category
- Premium Statistic Average monthly phone spam in the United States 2015-2020
- Premium Statistic Scam calls by type of phone line in the United States 2014-2020
- Premium Statistic Survey on the revenue development of magazine publishers in Germany 2019, by segment
- Premium Statistic Zee Entertainment's revenue growth rate India 2016-2021
- Premium Statistic Hot sauce brands' share of influencer voice worldwide as of 2017
- Premium Statistic Average call duration in UK contact centers from 2006 to 2017
About the region
10
- Premium Statistic Average duration of voice calls per active user per month in the CEE region 2022
- Basic Statistic Hungary: production value of wholesale and retail trade industry 2011-2020
- Premium Statistic Smartphone penetration rate in Hungary 2010-2022
- Premium Statistic Share of Hungarian households with telecommunications services 2022, by type
- Premium Statistic Satisfaction with small screen mobile internet services in Hungary 2019-2022
- Premium Statistic Per capita consumer spending on alcohol and tobacco in Hungary 2013-2028
- Premium Statistic Number of smartphone users in Hungary 2013-2028
- Premium Statistic On and off-trade beer sales share in Hungary 2011-2021
- Premium Statistic Distribution of domestic mobile calls in Hungary 2019-2022, by network type
- Basic Statistic Market share of Hungarian mobile network providers 2015-2022
Other regions
9
- Premium Statistic Distribution of dairy products sales in Belgium 2019, by purchase channel
- Premium Statistic Peru: cosmetic & hygiene products sales distribution 2010-2017, by channel
- Premium Statistic Global market share of soft lenses by replacement schedule 2016
- Premium Statistic Leading false eyelashes and adhesive brands sales growth in the U.S. 2019
- Premium Statistic Sales revenue of the Baltika Group worldwide 2022, by location
- Premium Statistic Global smartphone shipments of Chinese brands 2011-2017
- Premium Statistic Cosmetic sales value by channel in Norway 2014-2015
- Premium Statistic Sales loss in supermarkets because of out-of-stock the Netherlands 2017, by product
- Premium Statistic Share of channels used as part of an omnichannel business strategy in Hong Kong 2017
Related statistics
10
- Premium Statistic Average monthly SIM card voice traffic in Hungary 2017-2022, by type
- Premium Statistic Number of active SIM cards in Hungary 2015-2022
- Premium Statistic Share of post-paid SIM cards in use in Hungary 2015-2022
- Premium Statistic Average monthly SIM card traffic in Hungary 2015-2022
- Premium Statistic Share of Hungarian SIM cards initiating calls from abroad 2015-2022
- Premium Statistic Distribution of domestic mobile internet traffic by network type in Hungary 2017-2022
- Premium Statistic Share of Hungarian SIM cards generating mobile internet traffic abroad 2015-2022
- Premium Statistic Number of mobile phone subscriptions in Hungary 2015-2023, by type
- Premium Statistic Share of Hungarians not using mobile internet 2020, by reason
- Premium Statistic Share of smartphone users in Hungary 2020, by age
Further related statistics
10
- Apple iPhone sales worldwide 2007-2022
- Global PC sales via direct salesforces 2010, by vendor
- Footwear retail sales volume trend in Great Britain (UK) 2008-2022
- Net sales of GameStop worldwide 2010-2022, by region
- BlackBerry net income/loss 2009-2023
- Net sales of Dick's Sporting Goods U.S. 2006-2022
- China Mobile's EBITDA 2012-2022
- China Mobile's total assets 2012-2022
- Number of employees at China Telecom 2012-2022
- Sales share of L'Oréal's global cosmetic branch 2022, by geographic zone
Further Content: You might find this interesting as well
Statistics
- Apple iPhone sales worldwide 2007-2022
- Global PC sales via direct salesforces 2010, by vendor
- Footwear retail sales volume trend in Great Britain (UK) 2008-2022
- Net sales of GameStop worldwide 2010-2022, by region
- BlackBerry net income/loss 2009-2023
- Net sales of Dick's Sporting Goods U.S. 2006-2022
- China Mobile's EBITDA 2012-2022
- China Mobile's total assets 2012-2022
- Number of employees at China Telecom 2012-2022
- Sales share of L'Oréal's global cosmetic branch 2022, by geographic zone
Comnica. (May 1, 2021). Could you estimate what percentage of the calls you have received over the past year were sales calls? [Graph]. In Statista. Retrieved December 02, 2023, from https://www.statista.com/statistics/1240540/hungary-poll-on-the-share-of-telesales-in-total-calls/
Comnica. "Could you estimate what percentage of the calls you have received over the past year were sales calls?." Chart. May 1, 2021. Statista. Accessed December 02, 2023. https://www.statista.com/statistics/1240540/hungary-poll-on-the-share-of-telesales-in-total-calls/
Comnica. (2021). Could you estimate what percentage of the calls you have received over the past year were sales calls?. Statista. Statista Inc.. Accessed: December 02, 2023. https://www.statista.com/statistics/1240540/hungary-poll-on-the-share-of-telesales-in-total-calls/
Comnica. "Could You Estimate What Percentage of The Calls You Have Received over The past Year Were Sales Calls?." Statista, Statista Inc., 1 May 2021, https://www.statista.com/statistics/1240540/hungary-poll-on-the-share-of-telesales-in-total-calls/
Comnica, Could you estimate what percentage of the calls you have received over the past year were sales calls? Statista, https://www.statista.com/statistics/1240540/hungary-poll-on-the-share-of-telesales-in-total-calls/ (last visited December 02, 2023)
Could you estimate what percentage of the calls you have received over the past year were sales calls? [Graph], Comnica, May 1, 2021. [Online]. Available: https://www.statista.com/statistics/1240540/hungary-poll-on-the-share-of-telesales-in-total-calls/