
- Sports & Recreation›
- Sports & Fitness›
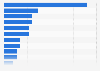
Major League Baseball hot dog prices by team 2018
Price for a hot dog in Major League Baseball by team in 2018 (in U.S. dollars)

Hot dog price in U.S. dollars | |
---|---|
New York Mets | 6.5 |
Chicago Cubs | 6.5 |
Los Angeles Dodgers | 6.5 |
Miami Marlins | 6.25 |
San Francisco Giants | 6.25 |
Seattle Mariners | 6 |
Texas Rangers | 6 |
Kansas City Royals | 5.75 |
Oakland Athletics | 5.5 |
Milwaukee Brewers | 5.5 |
Washington Nationals | 5.5 |
Houston Astros | 5.25 |
Colorado Rockies | 5.25 |
Cincinnati Reds | 5.25 |
San Diego Padres | 5.25 |
Boston Red Sox | 5.25 |
MLB league average | 5.01 |
St. Louis Cardinals | 5 |
Minnesota Twins | 5 |
Los Angeles Angels | 5 |
Tampa Bay Rays | 5 |
Detroit Tigers | 4.75 |
Chicago White Sox | 4.5 |
Atlanta Braves | 4.25 |
Toronto Blue Jays | 4.16 |
Cleveland Indians | 4 |
Philadelphia Phillies | 4 |
Arizona Diamondbacks | 4 |
Pittsburgh Pirates | 3.5 |
New York Yankees | 3 |
Baltimore Orioles | 1.5 |
© Statista 2019
About this statistic
Show source
Please be patient - this may take a moment
Description
Source
More information
- Show sources information
- Show publisher information
- Release date
- April 2018
- Region
- United States
- Survey time period
- 2018
- Region
- United States
- Survey time period
- 2018


You only have access to basic statistics.
- Instant access to 1m statistics
- Download in XLS, PDF & PNG format
- Detailed references
$49 / Month *
Corporate solution including all features.
Prices do not include sales tax.


All Information
in one Presentation
- 100 page/s
- English
- pptx
- Detailed references
Everything On "Major League Baseball" in One Document: Edited and Divided into Handy Chapters. Including Detailed References.
I think of Statista as Google for researchers. Statista provides you with the information you search for right away.Dr. Horst Stipp
EVP, Research & Innovation, Advertising Research Foundation
- League financials
- Major League Baseball total league revenue from 2001 to 2017 (in billion U.S. dollars)*Total revenue of Major League Baseball 2001-2017
- Average annual revenue per team in Major League Baseball from 2001 to 2017 (in million U.S. dollars)Average revenue per team in MLB 2001-2017
- Teams of Major League Baseball ranked by revenue in 2017 (in million U.S. dollars)Revenue of Major League Baseball teams 2017
- Major League Baseball: average operating income per franchise from 2005 to 2017 (in million U.S. dollars)Average operating income of Major League Baseball teams 2005-2017
- Major League Baseball - operating income by team in 2017 (in million U.S. dollars)Operating income of Major League Baseball franchises 2017
- Major League Baseball (MLB) gate receipts (ticketing revenue) from 2009 to 2017 (in billion U.S. dollars)*Gate receipts of Major League Baseball (MLB) 2009-2017
- Ticket sales as share of total Major League Baseball revenue from 2009 to 2017*MLB regular season ticketing revenue as percentage of total revenue 2009-2017
- Luxury tax payments* by Major League Baseball teams from 2003 to 2018 (in million U.S. dollars)Annual amount of luxury tax paid in Major League Baseball 2003-2018
- Brand & franchise value
- Major League Baseball average franchise value from 2002 to 2018 (in million U.S. dollars)Average team valuation in Major League Baseball 2002-2018
- Major League Baseball franchise value by team in 2018 (in million U.S. dollars)Franchise value of Major League Baseball teams 2018
- Brand value of the sports event MLB World Series from 2012 to 2017 (in million U.S. dollars)*Brand value of the MLB World Series 2012-2017
- Brand value of the sports media company MLBAM from 2012 to 2017 (in billion U.S. dollars)*Brand value of MLBAM 2012-2017
- Major League Baseball (league and teams) sponsorship revenue from 2010 to 2018 (in million U.S. dollars)MLB league and teams sponsorship revenue 2010-2018
- TV & media
- Average TV ratings of World Series games in the United States from 2000 to 2018Baseball World Series TV ratings in the U.S. 2000-2018
- Average TV viewership of World Series games in the United States from 2000 to 2018 (in millions)Baseball World Series TV viewership in the U.S. 2000-2018
- Major League Baseball average TV viewership - selected games 2017 season (in million viewers)Average TV viewership of selected Major League Baseball games 2017
- Twitter followers of Major League Baseball teams in 2018 (in 1,000s)*MLB teams - number of twitter followers 2018
- Facebook fans of Major League Baseball teams as of September 2018 (in millions)MLB teams - number of Facebook fans 2018
- Participation & popularity
- Number of participants in baseball in the United States from 2006 to 2017 (in millions)*Participants in baseball in the U.S. from 2006 to 2017
- Number of participants in U.S. high school baseball from 2009/10 to 2017/18Number of participants in U.S. high school baseball 2017/18, by gender
- What is your favorite sport to watch?U.S. adults' favorite sports to watch 2017
- Major League Baseball teams with the most Facebook fans as of April 2018 (in millions)Most popular MLB teams on Facebook 2018
- Game attendance & experience
- MLB stadiums built since 2000 ranked by total construction costs (in million U.S. dollars)*Construction costs of MLB stadiums built since 2000
- Major League Baseball: total attendance at regular season games from 2006 to 2018 (in millions)Total attendance at Major League Baseball regular season games 2006-2018
- MLB average total regular season home attendance per team from 2005 to 2018 (in millions)Average total home attendance per team in Major League Baseball 2018
- Teams of Major League Baseball ranked by total regular season home attendance in 2018 (in millions)Regular season home attendance of Major League Baseball teams 2018
- Average per game attendance (regular season) in Major League Baseball from 2009 to 2018MLB average per game attendance 2009-2018
- Fan Cost Index* of Major League Baseball teams in 2018 (in U.S. dollars)Fan Cost Index of MLB teams 2018
- Major League Baseball average ticket price from 2006 to 2018 (in U.S. dollars)*Average ticket price in Major League Baseball 2006-2018
- Major League Baseball average ticket price by team in 2018 (in U.S. dollars)*Average ticket price for an MLB game by team 2018
- Players & salaries
- Competitive Balance Tax payroll threshold in Major League Baseball from 2017 to 2021 (in million U.S. dollars)MLB Competitive Balance Tax payroll threshold 2017-2021
- Opening day payrolls of Major League Baseball teams in 2018 (in million U.S. dollars) Major League Baseball - payroll (opening day) by team 2018
- Average annual player salary in Major League Baseball by team in 2018 (in million U.S. dollars)Average player salary in MLB by team 2018
- Average player salary in Major League Baseball from 2003 to 2018 (in million U.S. dollars)Major League Baseball average player salary 2003-2018
- Minimum player salary in Major League Baseball from 2003 to 2016 (in 1,000 U.S. dollars)Major League Baseball (MLB) minimum player salary 2003-2019
- Highest player salaries in Major League Baseball in 2018 (in million U.S. dollars)Highest salaries in Major League Baseball 2018
- Highest paid players in Major League Baseball in 2018 (in million U.S. dollars)Major League Baseball - highest paid players 2018
- Number of players on Major League Baseball rosters on opening day from 2013 to 2017*MLB players on opening day rosters 2013-2017
- baseball
- Hot Dog
- MLB
- concession stand
- Show more
- fan
- cost
- Arizona Diamondbacks
- Atlanta Braves
- Baltimore Orioles
- Boston Red Sox
- Chicago Cubs
- Chicago White Sox
- Cincinnati Reds
- Cleveland Indians
- Colorado Rockies
- Detroit Tigers
- Houston Astros
- Kansas City Royals
- Los Angeles Angels
- Milwaukee Brewers
- Minnesota Twins
- New York Yankees
- Oakland Athletics
- Philadelphia Phillies
- Pittsburgh Pirates
- San Diego Padres
- San Francisco Giants
- Seattle Mariners
- Tampa Bay Rays
- Number of households with people who attended a Major League Baseball event in the U.S. 20...
- Major League Baseball World Series champion survey 2014
- Team people want the least to make the World Series 2014
- All time luxury tax payments of MLB clubs 1997-2012
- Top 10 most valuable MLB teams - brand value 2012
- Most watched World Series games in the U.S. 2016
- Average concession stand prices in the NFL 2006-2018
- National Hockey League: price of a hot dog at games by team 2014/15
- Distribution of World Series radio listeners by gender and team 2013
- Wholesale sales of baseball/softball sports equipment in the U.S. 2007-2017
- Amounts of frankfurters and hot dogs consumed in the U.S. 2011-2018
- Share of baseball players in the U.S. 2018, by age
- Rate of Japanese playing baseball in Japan 1996-2016
- Baseball wear market domestic shipment value in Japan 2014-2017
- Minor League Baseball - attendance by league 2012
- Baseball shoes domestic shipment volume in Japan 2013-2016
- Major League Baseball: average operating income per franchise from 2005 to 2017 (in million U.S. dollars)
- Ticket sales as share of total Major League Baseball revenue from 2009 to 2017*
- Luxury tax payments* by Major League Baseball teams from 2003 to 2018 (in million U.S. dollars)
- Number of World Series championships won by team from 1903 to 2018
- Major League Baseball franchise value by team in 2018 (in million U.S. dollars)
- Brand value of the sports event MLB World Series from 2012 to 2017 (in million U.S. dollars)*
- Brand value of the sports media company MLBAM from 2012 to 2017 (in billion U.S. dollars)*
- Major League Baseball (league and teams) sponsorship revenue from 2010 to 2018 (in million U.S. dollars)
- Major League Baseball average TV viewership - selected games 2017 season (in million viewers)
- Twitter followers of Major League Baseball teams in 2018 (in 1,000s)*
- Facebook fans of Major League Baseball teams as of September 2018 (in millions)
- Number of participants in baseball in the United States from 2006 to 2017 (in millions)*
- Number of participants in U.S. high school baseball from 2009/10 to 2017/18
- Major League Baseball teams with the most Facebook fans as of April 2018 (in millions)
- Fan Cost Index* of Major League Baseball teams in 2018 (in U.S. dollars)
- Major League Baseball average ticket price from 2006 to 2018 (in U.S. dollars)*
- Major League Baseball average ticket price by team in 2018 (in U.S. dollars)*
- Average concession stand prices in Major League Baseball from 2010 to 2018 (in U.S. dollars)
- Price for a beer* at Major League Baseball games by team in 2018 (in U.S. dollars)
- Price for a soft drink* in Major League Baseball by team in 2018 (in U.S. dollars)
- Price for a hot dog in Major League Baseball by team in 2018 (in U.S. dollars)
- Competitive Balance Tax payroll threshold in Major League Baseball from 2017 to 2021 (in million U.S. dollars)
- Opening day payrolls of Major League Baseball teams in 2018 (in million U.S. dollars)
- Average annual player salary in Major League Baseball by team in 2018 (in million U.S. dollars)
- Average player salary in Major League Baseball from 2003 to 2018 (in million U.S. dollars)
- Minimum player salary in Major League Baseball from 2003 to 2016 (in 1,000 U.S. dollars)
- Highest player salaries in Major League Baseball in 2018 (in million U.S. dollars)
- Highest paid players in Major League Baseball in 2018 (in million U.S. dollars)
- Number of players on Major League Baseball rosters on opening day from 2013 to 2017*
- Major League Baseball rosters by average player age in 2018 (in years)*
- Which team do you think will win the World Series this fall?
- Regardless of what team you think will win, which one team do you least want to see make it to the World Series this fall?
- Lifetime luxury tax payments of Major League Baseball clubs 1997-2012 (in million U.S. dollars)
- Top 10 most valuable Major League Baseball club brands in 2012 (in million U.S. dollars)
- Most watched MLB World Series games of all time in the United States as of November 2016 (in millions)
- Average concession stand prices in the National Football League from 2006 to 2018 (in U.S. dollars)
- Price of a hot dog at National Hockey League games by team in 2014/15 (in U.S. dollars)
- Minor League Baseball attendance by league in the U.S. from 2011 to 2012 (in millions)
- Major League Baseball total league revenue from 2001 to 2017 (in billion U.S. dollars)*
- Average annual revenue per team in Major League Baseball from 2001 to 2017 (in million U.S. dollars)
- Teams of Major League Baseball ranked by revenue in 2017 (in million U.S. dollars)
- Major League Baseball - operating income by team in 2017 (in million U.S. dollars)
- Major League Baseball (MLB) gate receipts (ticketing revenue) from 2009 to 2017 (in billion U.S. dollars)*
- Major League Baseball average franchise value from 2002 to 2018 (in million U.S. dollars)
- Average TV ratings of World Series games in the United States from 2000 to 2018
- Average TV viewership of World Series games in the United States from 2000 to 2018 (in millions)
- What is your favorite sport to watch?
- MLB stadiums built since 2000 ranked by total construction costs (in million U.S. dollars)*
- Major League Baseball: total attendance at regular season games from 2006 to 2018 (in millions)
- MLB average total regular season home attendance per team from 2005 to 2018 (in millions)
- Teams of Major League Baseball ranked by total regular season home attendance in 2018 (in millions)
- Average per game attendance (regular season) in Major League Baseball from 2009 to 2018
- Number of households with people who attended a Major League Baseball event in the U.S. 2018 to 2020
- Distribution of World Series radio listeners during the 2013 World Series, by gender and team
- Baseball/softball sports equipment wholesale sales in the U.S. from 2007 to 2017 (in million U.S. dollars)*
- U.S. population: Amount of frankfurters and hot dogs consumed from 2011 to 2018
- Share of Americans who played baseball in the last 12 months in 2018, by age
- Baseball participation rate in Japan from 1996 to 2016*
- Domestic shipment value of the baseball and softball apparel market in Japan from 2014 to 2017 (in billion Japanese Yen)
- Domestic shipment volume of baseball and softball shoes in Japan from 2013 to 2016 (in million pairs)
Statista offers dossiers and reports on over 170 industries. With Statista you are always able to make informed decisions and boost your work efficiency.
Internet & Telecommunications
- Social Media
- E-Commerce
- Online Video & Entertainment
- Advertising & Marketing
Consumer Goods & FMCG
- Alcoholic Beverages
- Cleaning Products
- Cosmetics & Personal Care
- Food & Nutrition
Retail & Trade
- Health & Hygiene
- International Trade
- Shopping Behavior
- Sports & Leisure
Travel, Tourism & Hospitality
- Business Travel
- Leisure Travel
- Accomodation
- Restaurants
Society
- Demographics
- Economy
- Education & Science
- Politics & Government
Transportation & Logistics
- Aviation
- Rail Transport
- Vehicles & Road Traffic
- Water Transport
Register in seconds and access exclusive features.
Basic Account |
Instant Access
Premium Account | ||
---|---|---|---|
Our servicesClick the question mark for further information | Free |
$49 per month* | |
Basic statistics | |||
Premium statistics | |||
Graph download
| |||
Download PDF | |||
Excel download
| |||
Register | Purchase now |
This feature is limited to our corporate solutions.
Please contact us to get started with full access to dossiers, forecasts, studies and international data.

The global plastics industry is growing by approximately three percent every year. This dossier provides information about the global plastics industry in general as well as chapters on the major types of plastic, and recycling rates.

Updates on eCommerce, Digital Media, eTravel, eServices and more
- Market figures for 2018 to 2023
- Company and startup profiles
- User demographics

U.S. coal production has steadily declined in the past decade, but has been in the news in recent years due to President Trump's desire to revitalize the industry. This document provides an overview of the key figures, leading companies, and the employment trends in the U.S. coal mining industry.

This new export feature offers
- Structured graphical representation of the data
- Tailored target group analysis
- Option for further processing

The Polish e-commerce market is one of the fastest developing e-commerce markets in Europe. The latest data for Poland is presented in this dossier.

Plastic waste is an issue of global concern. Since China banned the import of recycled plastic, the U.S. has had to make adjustments to its management of plastic waste. This dossier provides an overview of plastic waste in the U.S.

This dossier provides an overview of hedge funds worldwide. Global hedge fund assets, performance, investors, and other topics are highlighted.

The Outdoor Advertising Association of America covers amongst others
- Number of billboards
- Outdoor advertising revenue
- Number of out-of-home displays

Find data, perceptions & more about
- Economic consequences
- Impact on the labor market
- A second referendum

Understand the recent developments in the Spanish eCommerce market!
- URL-related revenues
- Relevant online store KPIs
- eCommerce-related contacts

- Extended statistical dossier
- Insights, explanations & interpretations
- Challenges of the digital future

eCommerce is rapidly becoming a part of the Latin American shopping culture. The dossier includes data on
- Regional online shopping events
- Events by country

The outline of potential impacts of Brexit on UK industries has been updated in the UK Industry Reports.

Italian enterprises invest significantly in digital marketing. Find out about
- Relevant aspects & KPIs
- New trends
- Different strategies

Statista European Football Benchmark
- The big 5 European leagues
- All about the clubs & fans
- Sponsors & how they fit in

What are online shoppers' payment preferences around the world?
- Data on all payment methods
- Analysis for 50 countries
- Forecasts up to 2023
We use cookies to personalize contents and ads, offer social media features, and analyze access to our website. In your browser settings you can configure or disable this, respectively, and can delete any already placed cookies. For details, please see your browser’s Help section (by pressing F1). Please see our privacy statement for details about how we use data.