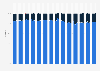
This statistic gives information on app usage by U.S. smartphone users in April 2009 and May 2010. In April 2009, 66 percent of smartphone users accessed apps to take pictures. In the following year, 76 percent of app users used picture apps.
Trend in smartphone app usage in the U.S. in April 2009 and in May 2010 (in percent)
Basic Account
Get to know the platform
You only have access to basic statistics.
This statistic is not included in your account.
Starter Account
The ideal entry-level account for individual users
- Instant access to 1m statistics
- Download in XLS, PDF & PNG format
- Detailed references
$199 USD / Month *
Professional Account
Full access
Business Solutions including all features.
* Prices do not include sales tax.
Other statistics that may interest you Statistics on
About the industry
10
- Premium Statistic Acceptance of mobile ads among Android and iOS users in China in 2012
- Premium Statistic Americans who used camera or photo editing apps in 2023, by income
- Premium Statistic Market share of music apps in India 2020
- Basic Statistic Leading gaming apps in Poland 2019, by users
- Premium Statistic Latin America: number of proximity mobile payment users 2018-2023
- Premium Statistic Leading Android shopping app reach in the United States 2019
- Premium Statistic Leading iOS shopping app reach worldwide 2019
- Basic Statistic Leading Android app reach worldwide 2019
- Premium Statistic Leading Android shopping app reach worldwide 2019
- Premium Statistic Leading Android app reach in the United States 2019
About the region
10
- Basic Statistic Number of text messages sent in the U.S. 2005-2021
- Premium Statistic Type of content downloaded or accessed online by U.S. consumers April 2017, by gender
- Premium Statistic Type of content downloaded or accessed online by U.S. consumers April 2017, by age
- Premium Statistic Type of content downloaded by U.S. consumers April 2017, by ethnicity
- Premium Statistic Type of content downloaded or accessed online by U.S. consumers April 2017
- Premium Statistic Share of smartphone owners in the U.S. 2023, by age
- Premium Statistic Americans who rented a car online in 2022, by income
- Premium Statistic Americans: share who used mobile payments 2022, by income
- Premium Statistic Leading non-gaming Android app publishers in the U.S. 2022, by downloads
- Premium Statistic Leading non-gaming iPhone app publishers in the U.S. 2022, by downloads
Selected statistics
1
Other regions
10
- Basic Statistic Favourite activities in public transport in France 2015
- Premium Statistic Use of mobile value-added services by mobile internet users in China 2011
- Premium Statistic Type of content downloaded or accessed online by UK consumers 2017
- Premium Statistic Use of banking applications in Poland 2019, by frequency
- Premium Statistic Forecast: number of mobile payment users in Asia Pacific 2009-2016
- Basic Statistic Time spent on iOS and Android apps in South Korea 2013, by category
- Basic Statistic Mobile cellular subscriptions per 100 inhabitants in Italy 2000-2022
- Premium Statistic Distribution of myGov account access in Australia 2018-2019, by device
- Premium Statistic Willingness to switch to 5G when available MENA 2019, by country
- Basic Statistic Belgium: mobile cellular subscriptions per 100 inhabitants 2000-2018
Related statistics
10
- Premium Statistic Quarterly mobile app consumer spend on mobile apps Q4 2023
- Basic Statistic Mobile app categories with highest uninstall rate 2023
- Premium Statistic Leading Android music and audio apps in the Netherlands 2022, by revenue
- Basic Statistic Leading non-gaming iPhone app publishers worldwide 2022, by downloads
- Premium Statistic Leading non-gaming iPad app publishers worldwide 2022, by downloads
- Premium Statistic Leading non-gaming Android app publishers worldwide 2022, by downloads
- Premium Statistic Most popular app categories worldwide 2021, by downloads
- Basic Statistic Global Google Play app revenue share 2019-2025, by category
- Basic Statistic Global Apple App Store app revenue share 2019-2025, by category
- Basic Statistic Leading app categories in the United States Q3 2020, by reach
Further related statistics
10
- Number of text messages sent in the U.S. 2004-2014
- China: 3G/4G share of total mobile connections
- China Mobile's EBITDA 2012-2022
- China Mobile's total assets 2012-2022
- Number of China Unicom mobile subscriptions 2012-2022
- Number of China Unicom fixed phone lines 2011-2021
- Pre-pay customer: Monthly mobile messages sent in the United Kingdom (UK) 2007-2018
- Apple iPhone sales worldwide 2007-2022
- Daily time children spent with media in the U.S. in 2011 and 2013
- Survey: ownership of mobile devices by U.S. American adults 2011-2012
Further Content: You might find this interesting as well
Statistics
- Number of text messages sent in the U.S. 2004-2014
- China: 3G/4G share of total mobile connections
- China Mobile's EBITDA 2012-2022
- China Mobile's total assets 2012-2022
- Number of China Unicom mobile subscriptions 2012-2022
- Number of China Unicom fixed phone lines 2011-2021
- Pre-pay customer: Monthly mobile messages sent in the United Kingdom (UK) 2007-2018
- Apple iPhone sales worldwide 2007-2022
- Daily time children spent with media in the U.S. in 2011 and 2013
- Survey: ownership of mobile devices by U.S. American adults 2011-2012
Pew Research Center. (July 7, 2010). Trend in smartphone app usage in the U.S. in April 2009 and in May 2010 (in percent) [Graph]. In Statista. Retrieved April 27, 2024, from https://www.statista.com/statistics/269284/smartphone-app-usage-in-the-united-states/
Pew Research Center. "Trend in smartphone app usage in the U.S. in April 2009 and in May 2010 (in percent)." Chart. July 7, 2010. Statista. Accessed April 27, 2024. https://www.statista.com/statistics/269284/smartphone-app-usage-in-the-united-states/
Pew Research Center. (2010). Trend in smartphone app usage in the U.S. in April 2009 and in May 2010 (in percent). Statista. Statista Inc.. Accessed: April 27, 2024. https://www.statista.com/statistics/269284/smartphone-app-usage-in-the-united-states/
Pew Research Center. "Trend in Smartphone App Usage in The U.S. in April 2009 and in May 2010 (in Percent)." Statista, Statista Inc., 7 Jul 2010, https://www.statista.com/statistics/269284/smartphone-app-usage-in-the-united-states/
Pew Research Center, Trend in smartphone app usage in the U.S. in April 2009 and in May 2010 (in percent) Statista, https://www.statista.com/statistics/269284/smartphone-app-usage-in-the-united-states/ (last visited April 27, 2024)
Trend in smartphone app usage in the U.S. in April 2009 and in May 2010 (in percent) [Graph], Pew Research Center, July 7, 2010. [Online]. Available: https://www.statista.com/statistics/269284/smartphone-app-usage-in-the-united-states/