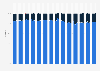
The statistic shows the smartphone unit shipments in the Asia Pacific region from 2013 to 2018. In 2018, 732 million smartphones were bought in the Asia Pacific region, indicating an increase of about 430.8 million smartphones.
Smartphone unit shipments in Asia Pacific from 2013 to 2018 (in million units)
Loading statistic...
Basic Account
Get to know the platform
You only have access to basic statistics.
Starter Account
The ideal entry-level account for individual users
- Instant access to 1m statistics
- Download in XLS, PDF & PNG format
- Detailed references
$59 USD $39 USD / Month *
in the first 12 months
Professional Account
Full access
Corporate solution including all features.
* Prices do not include sales tax.
Statistics on Smartphones in Italy
Overview
6
- Premium Statistic Consumer electronics revenue in Italy from 2020 to 2026
- Premium Statistic Mobile phone market revenue in Italy 2016-2026
- Premium Statistic Number of smartphone users in Italy 2017-2025
- Premium Statistic Smartphone user penetration rate in Italy 2017-2025
- Premium Statistic Mobile cellular subscriptions per 100 capita in Italy 2010-2025
- Premium Statistic Average smartphone price in Italy 2013-2026
Companies
5
- Premium Statistic Leading mobile device vendors in Italy 2016-2021, by market share
- Premium Statistic Leading mobile operating systems ranked by market share in Italy 2010-2021
- Premium Statistic Apple iOS market share in Italy 2016-2022
- Premium Statistic Android OS market share in Italy Q2 2017-Q4 2021, by version
- Premium Statistic Most popular smartphone brands in Italy 2021
Consumption
4
Mobile broadband
6
- Premium Statistic Mobile network revenues of telecommunication operators in Italy 2013-2021
- Premium Statistic Revenues from mobile data services 2013-2021, by service type
- Premium Statistic Revenue per unit of mobile data services in Italy 2013-2021
- Premium Statistic Mobile data traffic in Italy 2013-2020
- Premium Statistic Average monthly SIM cards' data traffic in Italy 2012-2021
- Premium Statistic Mobile data plan in Italy 2022
Mobile carriers and SIM cards
7
- Premium Statistic Market share of mobile network providers in Italy 2021
- Premium Statistic Market share of mobile network providers in Italy 2021, by segment
- Premium Statistic Smartphone by mobile carrier / brand in Italy 2022
- Premium Statistic Satisfaction with mobile carrier in Italy 2022
- Premium Statistic Number of SIM cards in Italy 2014-2021
- Premium Statistic Distribution of SIM cards in Italy 2014-2021, by contract type
- Premium Statistic Mobile ARPU per SIM card 2013-2021, by service type
Special focus: 5G
5
- Premium Statistic Share of mobile connections in Italy 2020-2025, by technology
- Premium Statistic Total costs of 5G eMBB deployment in Italy 2020, 2025 and 2040
- Premium Statistic 700MHz (5G) coverage in Italy 2023 and 2025
- Premium Statistic 3.5GHz (5G) coverage in Italy 2023-2025
- Premium Statistic Share of macro sites in Italy with rolled-out 700MHz and 3.5GHz (5G) 2023-2030
Further related statistics
14
- Middle East and Africa smartphone unit shipments 2013-2017
- Smartphone sales value APAC 2013-2018
- Middle East and Africa smartphone sales value 2013-2017
- Latin America smartphone sales value 2013-2017
- Smartphone shipping volume Australia Q4 2017, by operating system
- Smartphone triple camera share by brand worldwide 2019
- Market share of smartphone manufacturers in China Q3 2018
- Smartphone market share in Macau 2023 by vendor
- Market share of handset manufacturers in the United Kingdom (UK) 2015
- North America smartphone sales value 2013-2017
- Market share of smartphone manufacturers in the United Kingdom (UK) 2011-2012
- China smartphone unit shipments by vendor/brand 2011-2017
- Central & Eastern Europe smartphone sales value 2013-2017
- Global smartphone unit shipments by region 2013-2017
Further Content: You might find this interesting as well
Statistics
- Middle East and Africa smartphone unit shipments 2013-2017
- Smartphone sales value APAC 2013-2018
- Middle East and Africa smartphone sales value 2013-2017
- Latin America smartphone sales value 2013-2017
- Smartphone shipping volume Australia Q4 2017, by operating system
- Smartphone triple camera share by brand worldwide 2019
- Market share of smartphone manufacturers in China Q3 2018
- Smartphone market share in Macau 2023 by vendor
- Market share of handset manufacturers in the United Kingdom (UK) 2015
- North America smartphone sales value 2013-2017
- Market share of smartphone manufacturers in the United Kingdom (UK) 2011-2012
- China smartphone unit shipments by vendor/brand 2011-2017
- Central & Eastern Europe smartphone sales value 2013-2017
- Global smartphone unit shipments by region 2013-2017
Topics

GfK. (February 25, 2019). Smartphone unit shipments in Asia Pacific from 2013 to 2018 (in million units) [Graph]. In Statista. Retrieved February 04, 2023, from https://www.statista.com/statistics/412235/global-smartphone-shipments-asia-pacific/
GfK. "Smartphone unit shipments in Asia Pacific from 2013 to 2018 (in million units)." Chart. February 25, 2019. Statista. Accessed February 04, 2023. https://www.statista.com/statistics/412235/global-smartphone-shipments-asia-pacific/
GfK. (2019). Smartphone unit shipments in Asia Pacific from 2013 to 2018 (in million units). Statista. Statista Inc.. Accessed: February 04, 2023. https://www.statista.com/statistics/412235/global-smartphone-shipments-asia-pacific/
GfK. "Smartphone Unit Shipments in Asia Pacific from 2013 to 2018 (in Million Units)." Statista, Statista Inc., 25 Feb 2019, https://www.statista.com/statistics/412235/global-smartphone-shipments-asia-pacific/
GfK, Smartphone unit shipments in Asia Pacific from 2013 to 2018 (in million units) Statista, https://www.statista.com/statistics/412235/global-smartphone-shipments-asia-pacific/ (last visited February 04, 2023)
Smartphone unit shipments in Asia Pacific from 2013 to 2018 (in million units) [Graph], GfK, February 25, 2019. [Online]. Available: https://www.statista.com/statistics/412235/global-smartphone-shipments-asia-pacific/