ZenithOptimedia, the daily media consumption per capita in that region amounted to approximately 411 minutes in 2018.
The statistic presents data on the daily time spent with media per capita in the Asia Pacific region from 2011 to 2018 with forecasts until 2020. According to data from Daily time spent with media per capita in the Asia Pacific region from 2011 to 2020 (in minutes)*
Basic Account
Get to know the platform
You only have access to basic statistics.
This statistic is not included in your account.
Starter Account
The ideal entry-level account for individual users
- Instant access to 1m statistics
- Download in XLS, PDF & PNG format
- Detailed references
$229 USD $199 USD / Month *
in the first 12 months
Professional Account
Full access
Business Solutions including all features.
* Prices do not include sales tax.
Other statistics that may interest you Statistics on
About the industry
10
- Premium Statistic Time spent with media in MENA 2011-2020
- Premium Statistic Media penetration in Indonesia 2014
- Premium Statistic Media daily reach in Canada from 2011 to 2017, by type of media
- Basic Statistic Media important for U.S. consumers 2014
- Premium Statistic Media usage in Morocco 2022
- Premium Statistic Media usage in China 2022
- Premium Statistic Media usage in Australia 2022
- Premium Statistic Media usage in India 2022
- Premium Statistic Media usage in Mexico 2022
- Premium Statistic Media penetration in Spain 2022, by medium
About the region
10
- Premium Statistic Daily time spent on using desktop internet in APAC 2011-2021
- Premium Statistic Daily time spent on using mobile internet in APAC 2011-2021
- Premium Statistic Daily time spent on media consumption in APAC 2018-2021, by type
- Premium Statistic 
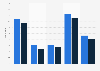
Time spent with media APAC 2011-2020, by medium
- Premium Statistic Daily time spent on reading magazines in APAC 2011-2021
- Premium Statistic Daily time spent on watching television in APAC 2011-2021
- Premium Statistic Daily time spent on listening to the radio in APAC 2011-2021
- Premium Statistic Daily time spent at the cinema in APAC 2011-2021
- Premium Statistic Daily time spent on out-of-home media in APAC 2011-2021
- Premium Statistic Daily time spent on using the internet in APAC 2011-2021
Selected statistics
4
- Basic Statistic Media influencing final decisions about politics in the U.S. in 2011
- Premium Statistic Daily time children spent with media in the U.S. in 2011 and 2013
- Premium Statistic Device usage among children to consume media in the United Kingdom (UK) 2013-2019
- Premium Statistic Average time spent with magazines in North America in 2018, by format
Other regions
10
- Premium Statistic Survey on the most popular media activities in Germany 2014
- Premium Statistic Media penetration in urban Indonesia from 2009 to 2012
- Basic Statistic Weekly reach of traditional and online media news in Finland 2015-2023
- Premium Statistic Net trust index in Spain 2015-2016, by media
- Basic Statistic Most preferred sources of entertainment in India in 2011
- Premium Statistic Media usage by channel in Brazil 2020
- Premium Statistic Time spent with media in Mexico 2013-2018
- Basic Statistic Chile: time spent with media 2010-2018
- Premium Statistic Time spent on reading and browsing activities in the United Kingdom (UK) 2015
- Premium Statistic Forecasted share of turnover on advertising in Denmark 2017, by advertising channel
Related statistics
10
- Premium Statistic Daily time spent on reading the newspaper in APAC 2011-2021
- Premium Statistic Average time reading newspapers per week APAC 2014 by country or region
- Premium Statistic Average time watching TV per week APAC 2014 by country or region
- Premium Statistic Internet penetration rate Bhutan 2011-2021
- Premium Statistic Internet penetration rate Kazakhstan 2011-2021
- Premium Statistic Internet penetration rate Nepal 2011-2020
- Premium Statistic Internet penetration rate Cambodia 2009-2019
- Premium Statistic Internet penetration rate Mongolia 2011-2021
- Premium Statistic Number of pay TV subscribers APAC 2021-2022, by country
- Premium Statistic Internet economy size SEA 2022, by country
Further related statistics
10
- Hours of internet use per week in the United Kingdom (UK) 2005-2019, by location
- NBC Universal's operating income 2010-2016
- Digital news purchases worldwide 2023
- Revenue of Sohu in China 2022, by segment
- Baidu's total revenue 2012-2022
- FIFA: revenue from television broadcasting rights 2003-2022
- UK console gaming reach 2015-2022, by gender
- Minutes per day spent watching broadcast TV in the UK 2010-2022, by age
- Use of a smart TV to go online in the UK 2013-2020, by age
- Households with internet access in GB from 2014 to 2020, by household composition
Further Content: You might find this interesting as well
Statistics
- Hours of internet use per week in the United Kingdom (UK) 2005-2019, by location
- NBC Universal's operating income 2010-2016
- Digital news purchases worldwide 2023
- Revenue of Sohu in China 2022, by segment
- Baidu's total revenue 2012-2022
- FIFA: revenue from television broadcasting rights 2003-2022
- UK console gaming reach 2015-2022, by gender
- Minutes per day spent watching broadcast TV in the UK 2010-2022, by age
- Use of a smart TV to go online in the UK 2013-2020, by age
- Households with internet access in GB from 2014 to 2020, by household composition
Zenith. (May 29, 2018). Daily time spent with media per capita in the Asia Pacific region from 2011 to 2020 (in minutes)* [Graph]. In Statista. Retrieved October 03, 2023, from https://www.statista.com/statistics/480369/time-spent-with-media-asia-pacific/
Zenith. "Daily time spent with media per capita in the Asia Pacific region from 2011 to 2020 (in minutes)*." Chart. May 29, 2018. Statista. Accessed October 03, 2023. https://www.statista.com/statistics/480369/time-spent-with-media-asia-pacific/
Zenith. (2018). Daily time spent with media per capita in the Asia Pacific region from 2011 to 2020 (in minutes)*. Statista. Statista Inc.. Accessed: October 03, 2023. https://www.statista.com/statistics/480369/time-spent-with-media-asia-pacific/
Zenith. "Daily Time Spent with Media per Capita in The Asia Pacific Region from 2011 to 2020 (in Minutes)*." Statista, Statista Inc., 29 May 2018, https://www.statista.com/statistics/480369/time-spent-with-media-asia-pacific/
Zenith, Daily time spent with media per capita in the Asia Pacific region from 2011 to 2020 (in minutes)* Statista, https://www.statista.com/statistics/480369/time-spent-with-media-asia-pacific/ (last visited October 03, 2023)
Daily time spent with media per capita in the Asia Pacific region from 2011 to 2020 (in minutes)* [Graph], Zenith, May 29, 2018. [Online]. Available: https://www.statista.com/statistics/480369/time-spent-with-media-asia-pacific/